![]() Background |
Models |
Projects |
Publications |
People |
News
Background |
Models |
Projects |
Publications |
People |
News
![]() Background |
Models |
Projects |
Publications |
People |
News
Background |
Models |
Projects |
Publications |
People |
News
Scope of Projects
Everglades regional: Sulfer & MeHg
Everglades subregional: WCA2A Wading Bird Suitability
Florida Coastal Everglades LTER
Everglades regional: SERES project
Spain Segura Basin: Ecological Economics
Everglades regional: CERP ASR
Everglades regional: CERP Decomp
Everglades WCA-1: unique restoration
Louisiana Davis Pond: restoration prototype
Everglades regional: cal/val (ELM v. 2.8)
Everglades regional: cal/val (ELM v. 2.5)
Primary conclusions: this (2006 version of the) model works, meeting the needs associated with a variety of research and management goals; we have moved on to newer model versions (see ELM v2.8 page), that have numerous improvements.
The regional applications encompass about 10,400 km2 region of the greater Everglades system.
There are currently two regional applications: one utilizes a 500 m resolution grid, and the other is at a 1 km resolution.
While we still maintain the 1 km resolution regional application in updated model code/data versions (e.g., v2.8), most projects (such as CERP Decomp Proj) will likely utilize the ELM 500m regional application.
Here we provide a brief overview of an earlier version (ELM v2.5.2) of the regional application that uses a 1 km grid resolution.
This model application is discussed in numerous documents in the Publications link, including the Model Documentation Report,
and the peer review of the model application by an independent panel of experts,
who indicated it is highly suitable for application to Everglades restoration projects (their report is available here).
For this version of the regional application, the primary 'Performance Measures' available for Everglades restoration project planning purposes involve phosphorus water quality.
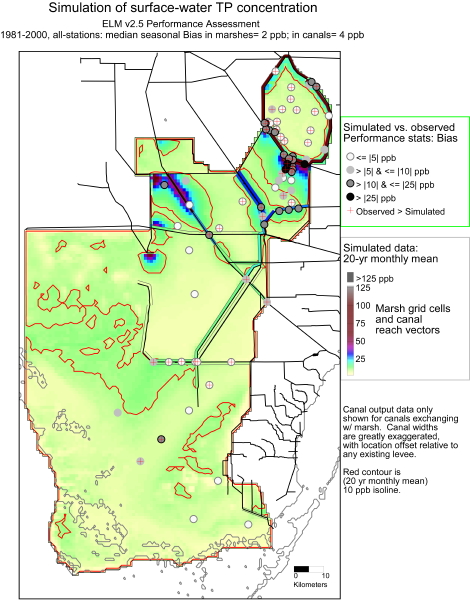
Extensive data are available for calibrating-validating surface water phosphorus (P) concentrations; during a 2-decade period, the model had a 2 ug L-1 (ppb) median bias in predictions of that Performance Measure within the marshes and canals (above figure).
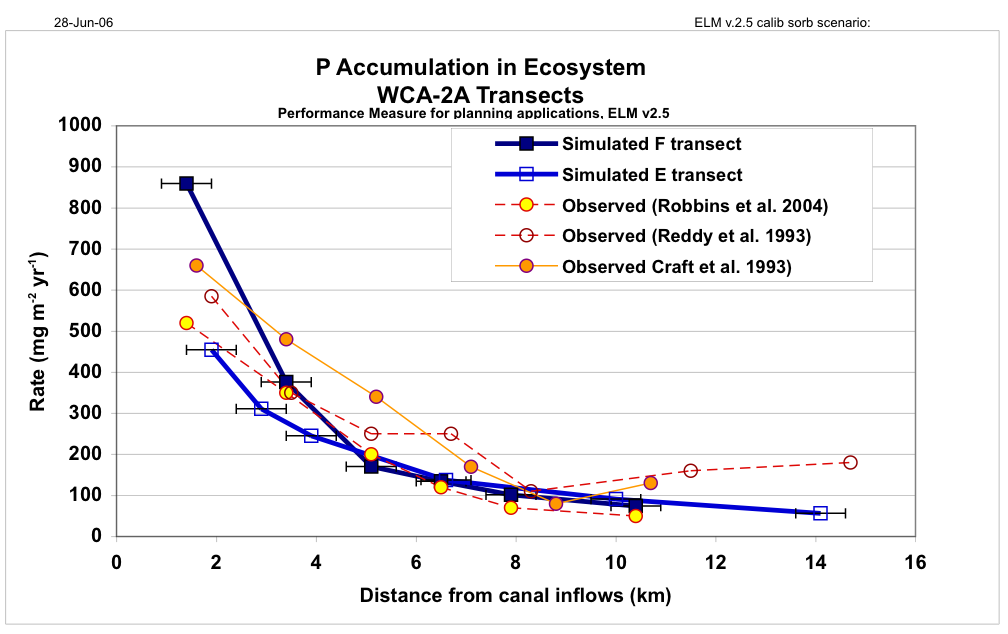 Predicted P accumulation along a multiple- decade eutrophication gradient showed a high degree of concordance with P accumulation estimates from radionuclide markers.
With other predicted ecological attributes and rates being consistent with available observations, there is cumulative, strong evidence of model skill in predicting phosphorus trends in the regional Everglades landscape at the relevant decadal time scales.
Thorough documentation of the hydrologic, water quality, and other ecological performance characteristics are found in the Model Performance Chapter 6 of the ELM v2.5 Documentation Report, located in the Publications link.
While rigorous comparisons of simulated to observed data at points along gradients are important in demonstrating model performance, 2D and 3D animations provide a rich amount of information on the model capabilities.
Quicktime movie (mov 11.2 mb) of ELM v2.4 (not current version) 3D regional ELM summary of surface water quality and cattail succession, morphed into short examples of 2D ELM v2.4 subregional time series animations of porewater phosphorus in Water Conservation Area 2A and surface-water chloride (tracer) in Water Conservation Area 1.
Be sure to view the Publications link in the main menu above, for manuscripts and reports on regional ELM development and application.
 EcoLandMod Projects