![]() Background |
Models |
Projects |
Publications |
People |
News
Background |
Models |
Projects |
Publications |
People |
News
![]() Background |
Models |
Projects |
Publications |
People |
News
Background |
Models |
Projects |
Publications |
People |
News
Scope of Projects
Everglades regional: Sulfer & MeHg
Everglades subregional: WCA2A Wading Bird Suitability
Florida Coastal Everglades LTER
Everglades regional: SERES project
Spain Segura Basin: Ecological Economics
Everglades regional: CERP ASR
Everglades regional: CERP Decomp
Everglades WCA-1: unique restoration
Louisiana Davis Pond: restoration prototype
Everglades regional: cal/val (ELM v. 2.8)
Everglades regional: cal/val (ELM v. 2.5)
The target audience for this page is the scientific team developing the Synthesis of Everglades Research and Ecosystem Services (SERES) project.
Thus, we do not attempt to describe the goals of the SERES Project itself, nor the documents describing the work done to date (see the SERES products).
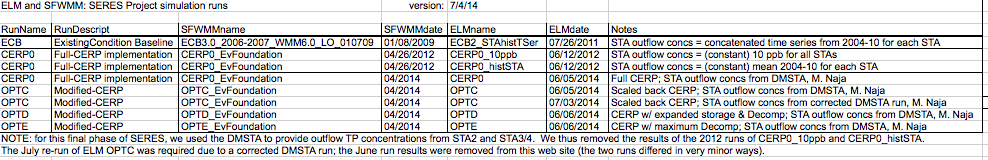
This page provides the SERES scientists with results of ELM simulation of the Existing Condition Base (ECB), the updated full-CERP implementation (CERP0), and 3 other modified CERP planning scenarios.
The Model Documentation report on the ELM v2.8.4 historical (calibration/validation) performance assessment
(including data, code, model performance assessment, and user's guide) is found in the Publications link. (Note: Code changes from ELM v2.8.4 to v2.8.6 do not effect any results related to this project).
Note: That report is separate from the documentation of the ELM applications that support the SERES project, which is the topic of this web page.
Here we document the assumptions and results of applying ELM v2.8.6 to aid in future project planning for the SERES project.
See  this one-page summary of the basic information on ELM and its assumptions specific to the SERES project.
This section links to documentation of model assumptions, inputs, and outputs for the ECB, CERP0, OPTC, OPTD, and OPTE simulation runs.
Timeline of updates to this page.
Page Contents - Major headings
0.4 Mb - Summary table of input data for simulations (from Decomp project; SERES apps use analogous methods).
1.2 Mb - Input map data that are common to all Decomp project simulations (same as SERES).
Note: Please see the above "Summary table of input data for simulations".
For detailed hydrologic assumptions used by the SFWMM (whose managed water control structure flows drive these ELM simulations),
please see the relevant documentation for the application of the SFWMM.
Water management infrastructure data
0.1 Mb, July 27, 2011 - ECB: Canal/levee and water control structure map (ECB2_STAhistTSer run).
9.3 Mb, July 27, 2011 -
ECB: Water control structure attributes, including into-domain constituent (P, Cl) inflow concentrations (database export graphic) (ECB2_STAhistTSer run).
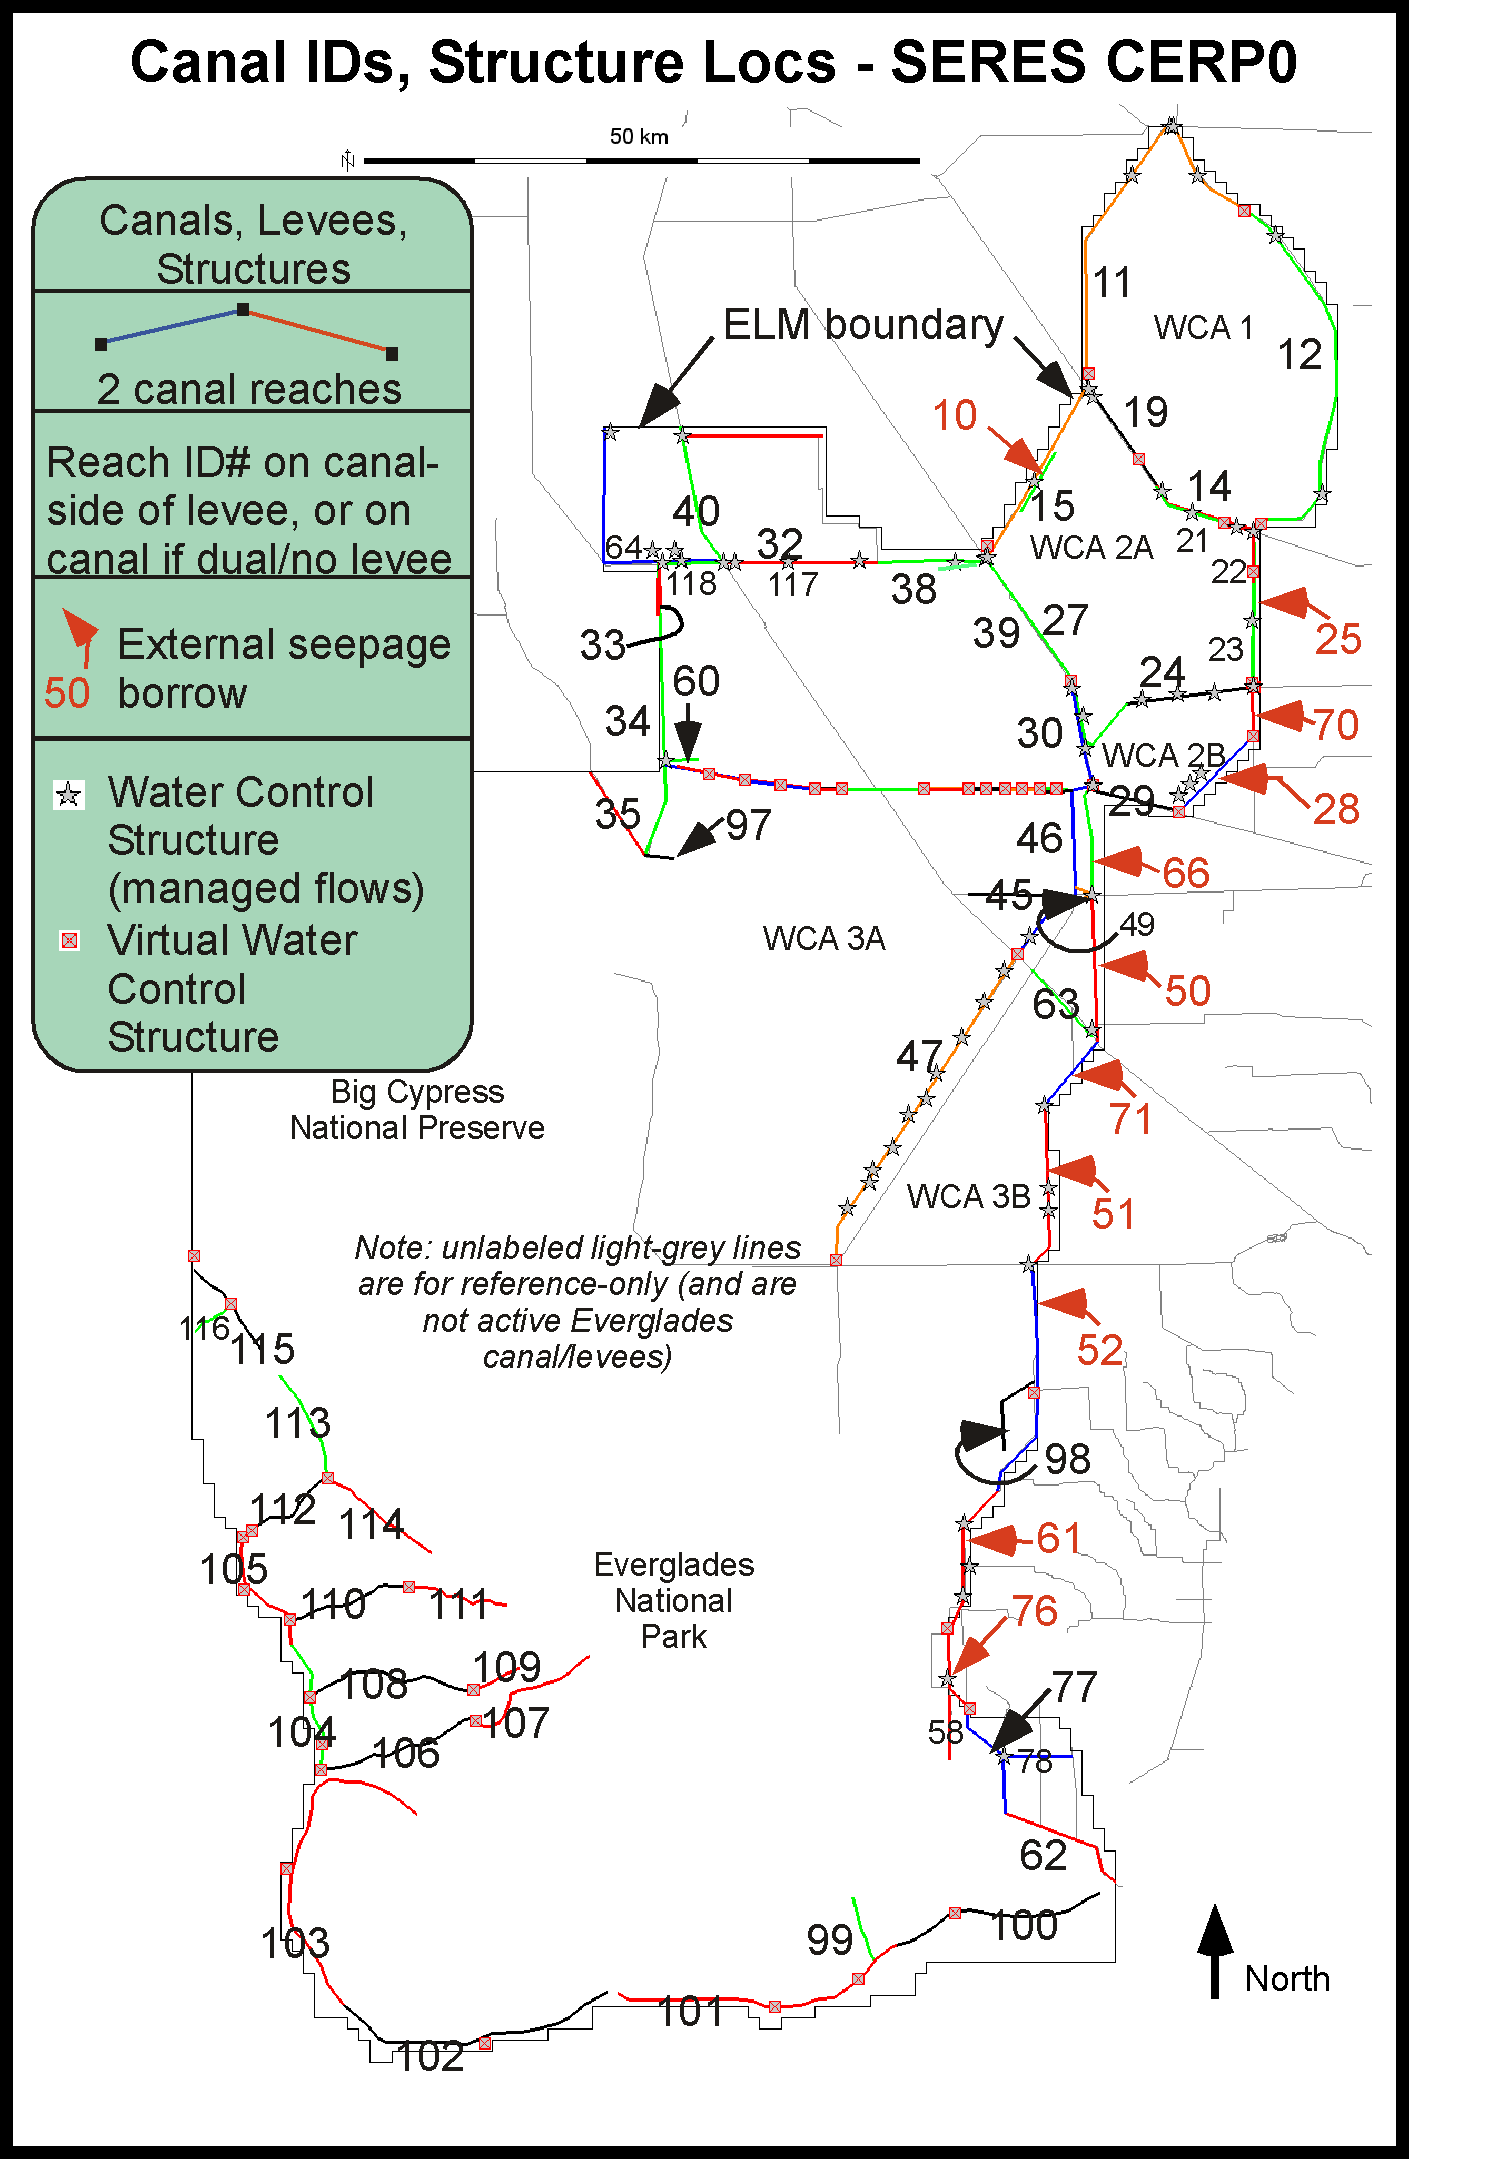
0.1 Mb, June 6, 2014 - CERP0: Canal/levee and water control structure map (CERP0 run).
9.3 Mb, June 6, 2014 -
CERP0: Water control structure attributes, including into-domain constituent (P, Cl) inflow concentrations (database export graphic) (CERP0 run).
OPTC: Canal/levee and water control structure map is the same as that for the CERP0 run.
9.1 Mb, June 6, 2014 -
OPTC: Water control structure attributes, including into-domain constituent (P, Cl) inflow concentrations (database export graphic) (OPTC run).
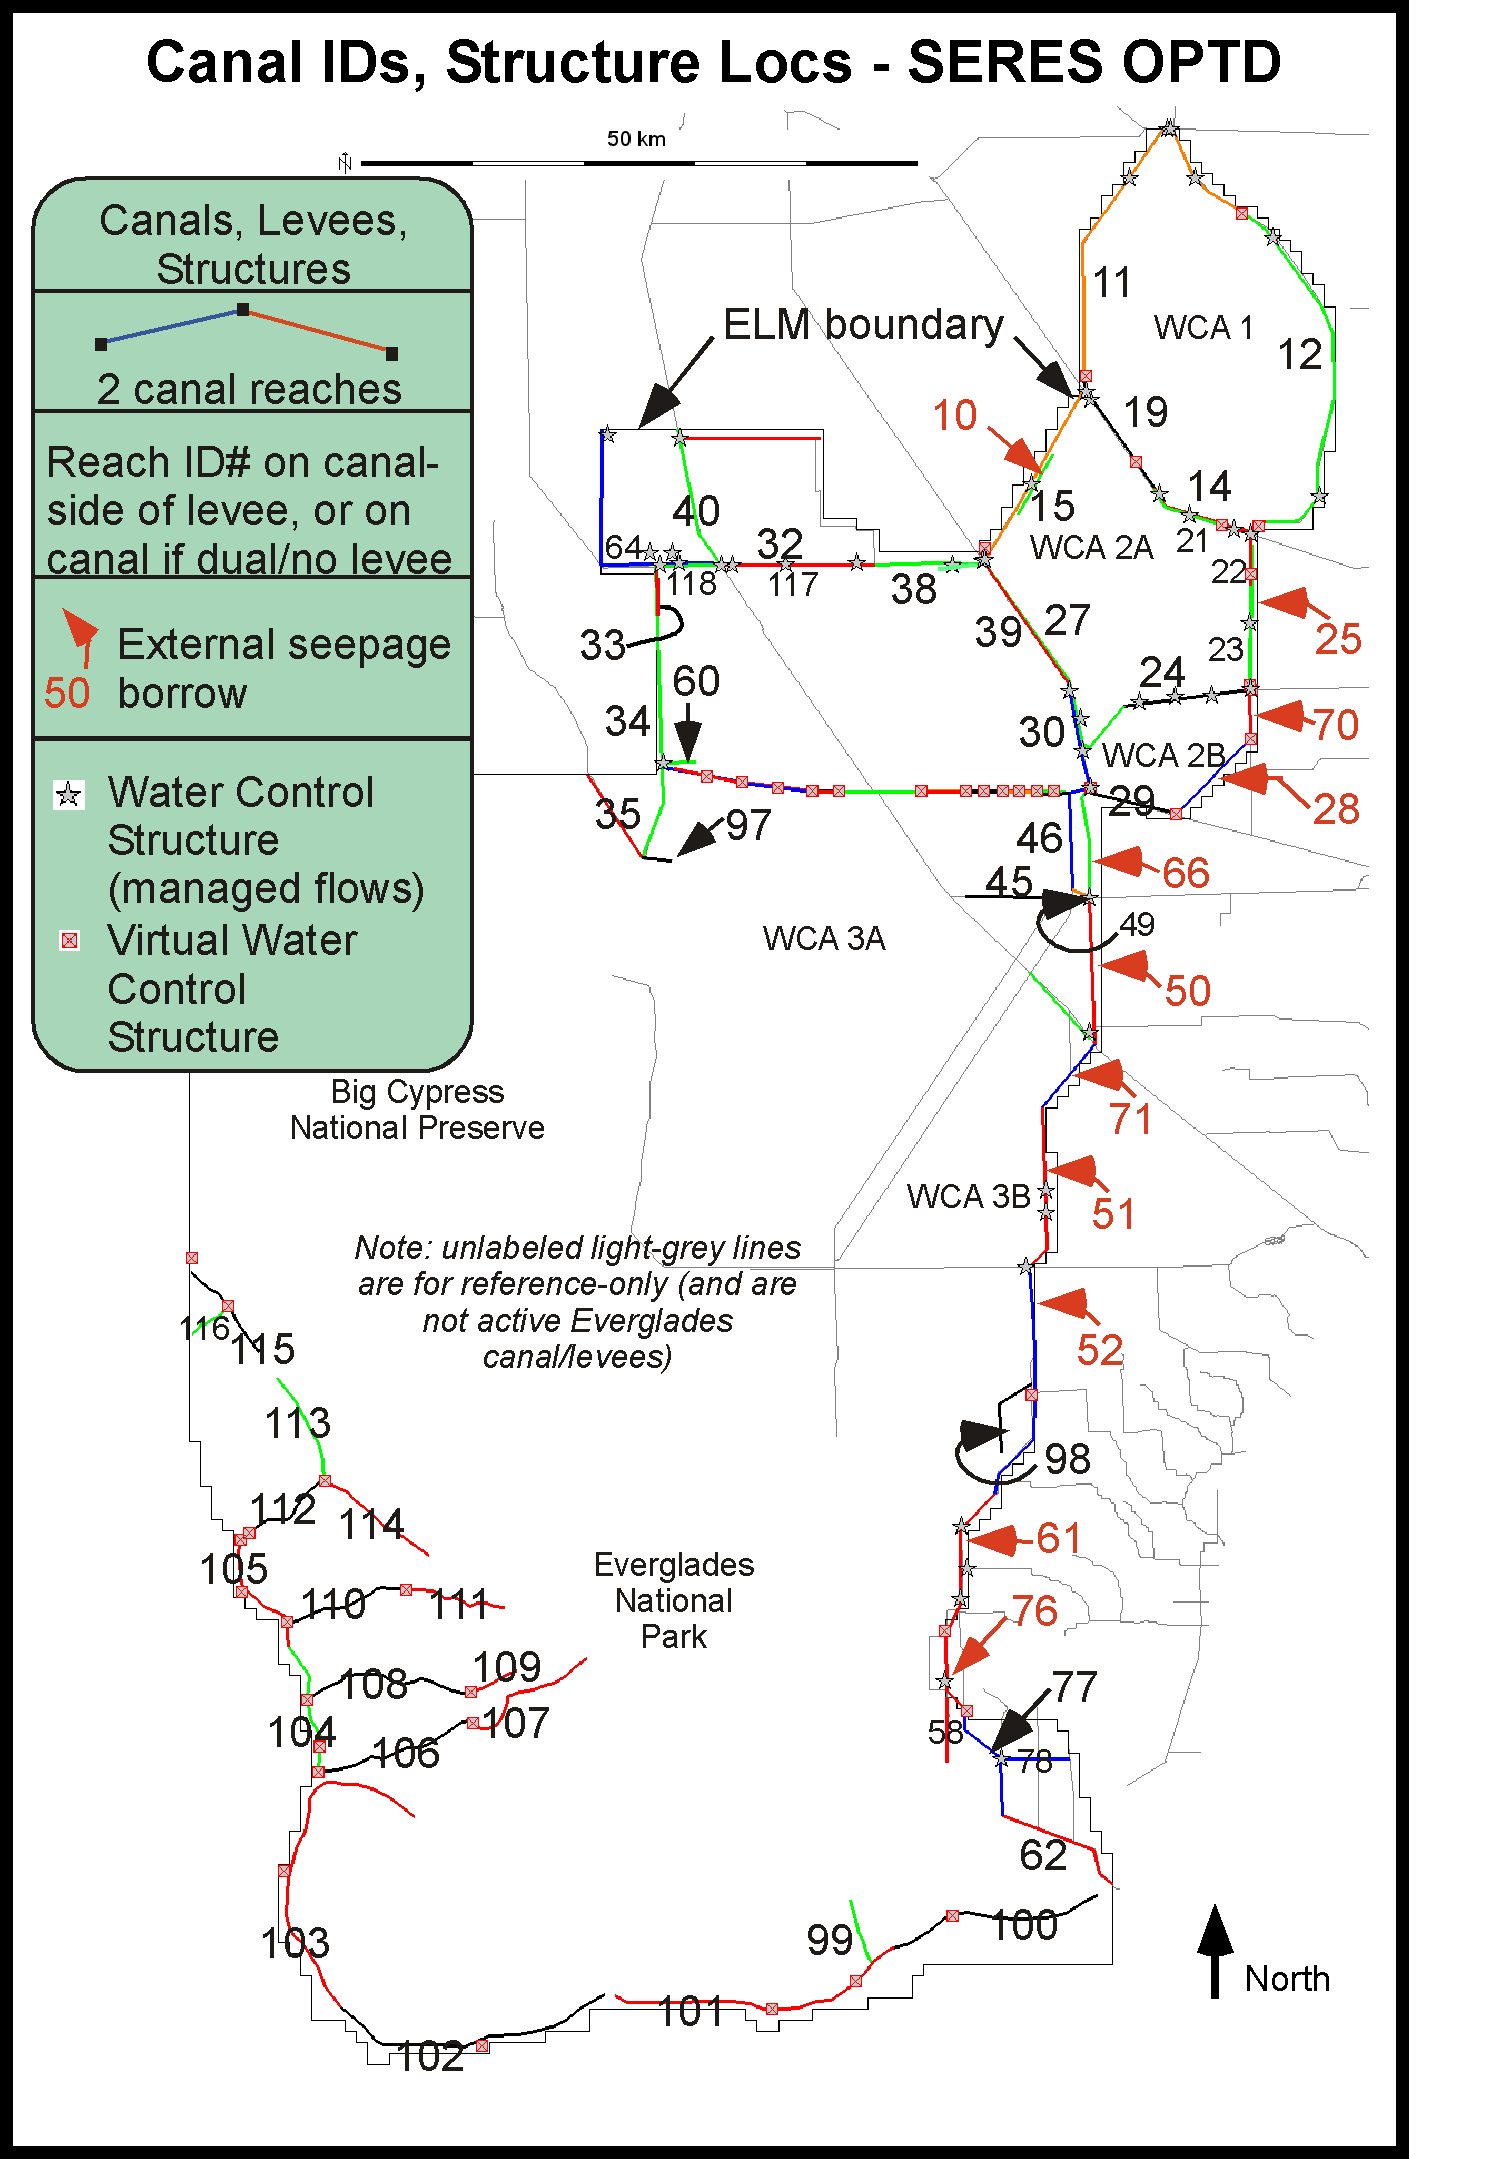
0.1 Mb, June 6, 2014 - OPTD: Canal/levee and water control structure map (OPTD run).
8.5 Mb, June 6, 2014 -
OPTD: Water control structure attributes, including into-domain constituent (P, Cl) inflow concentrations (database export graphic) (OPTD run).
0.1 Mb, June 6, 2014 - OPTE: Canal/levee and water control structure map (OPTE run).
8.0 Mb, June 6, 2014 -
OPTE: Water control structure attributes, including into-domain constituent (P, Cl) inflow concentrations (database export graphic) (OPTE run).
(Below is the same file summary used in Decomp PIR1, and does not include what Decomp team referred to as ELM supplementary metrics). Performance Indicators are quantitative metrics used to make relative comparisons among baseline and alternative simulations. (The term Performance Measure was not used for Decomp ELM apps, as the ELM simulations were used primarily to evaluate any potential water quality constraints on the Decomp project planning).
0.1 Mb, Sep 1, 2011 -
Summary table of the Performance Indicator metrics that are used to make relative comparisons among ELM-simulated baselines and alternatives.
Includes description of the Performance Indicator, and guidance on their use and interpretation.
(These Performance Indicators were developed by the Decomp PDT members in spring 2011, based on RECOVER Performance Measures and related documents).
For evaluations of the SERES project, we use relative comparisons of the full CERP (CERP0) to the Existing Condition Base (ECB), then relative comparisons of the 3 restoration options to CERP0.
In addition to the formal Performance Indicator metrics described above (for Decomp), for SERES we provide a larger suite of hydro-ecological metrics.
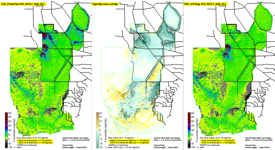
Included are difference-maps for
Summary of Performance metrics Results for the ECB and four restoration scenario runs.
![]() 0.8 Mb, July 4, 2014 - ECB, CERP0, OPTC, OPTD, and OPTE: Summary graphic (area of marsh within the regional domain) of the hydro-ecological (primarily water quality)
Performance Indicator differences between scenarios.
(FYI, for the end-of-season TP concentrations in surface water: Dry season end is April, Wet season end is September; Example-Dry-Year is 1989, Example-Wet-Year is 1994, Example-Average-Year is 1978.)
0.8 Mb, July 4, 2014 - ECB, CERP0, OPTC, OPTD, and OPTE: Summary graphic (area of marsh within the regional domain) of the hydro-ecological (primarily water quality)
Performance Indicator differences between scenarios.
(FYI, for the end-of-season TP concentrations in surface water: Dry season end is April, Wet season end is September; Example-Dry-Year is 1989, Example-Wet-Year is 1994, Example-Average-Year is 1978.)
0.1 Mb xls file, July 4, 2014 - Excel (.xls) file containing the summary data table for the above pdf graphic.
CERP0
Performance metrics Maps
 33.8 Mb, Jun 6, 2014 - CERP0 vs ECB: Maps of the hydro-ecological differences between the two simulations.
OPTC
Performance metrics Maps
31.2 Mb, Jul 4, 2014 - OPTC vs CERP0: Maps of the hydro-ecological differences between the two simulations.
OPTD
Performance metrics Maps
32 Mb, Jun 6, 2014 - OPTD vs CERP0: Maps of the hydro-ecological differences between the two simulations.
OPTE
Performance metrics Maps
31.8 Mb, Jun 6, 2014 - OPTE vs CERP0: Maps of the hydro-ecological differences between the two simulations.
 EcoLandMod Projects