![]() Background |
Models |
Projects |
Publications |
People |
News
Background |
Models |
Projects |
Publications |
People |
News
![]() Background |
Models |
Projects |
Publications |
People |
News
Background |
Models |
Projects |
Publications |
People |
News
Scope of Projects
Everglades regional: Sulfer & MeHg
Everglades subregional: WCA2A Wading Bird Suitability
Florida Coastal Everglades LTER
Everglades regional: SERES project
Spain Segura Basin: Ecological Economics
Everglades regional: CERP ASR
Everglades regional: CERP Decomp
Everglades WCA-1: unique restoration
Louisiana Davis Pond: restoration prototype
Everglades regional: cal/val (ELM v. 2.8)
Everglades regional: cal/val (ELM v. 2.5)
The target audience for this page is the South Florida Water Management District (SFWMD) scientific team working on a hypothetical regulation schedule that is intended
to provide depths and hydropatterns that are more suitable for wading birds (and other wildlife) in the Everglades Water Conservation Area 2A (WCA-2A).
Here, we do not attempt to detail the specifics of the Project objectives, nor the documents describing other work done to date.
This page provides the SFWMD scientists with results of ELM simulation of WCA-2A Wading Bird Suitability and other ecosystem responses to scenarios of altered water management.
The Model Documentation report on the ELMwca2a v2.9.0 update and applications
(including data, code, model performance assessment, and model application) is available in the Publications link.
Note: That report includes a Model Application chapter, briefly summarizing the application to the WCA-2A Wading Bird Suitability project, but this web page contains all of the comprehensive results.
Here we document the assumptions and results of applying ELM v2.9.0 to aid in understanding the relative responses of the ecosystem to scenarios of altered water management.
June 2015 (Aug revision). Wading Bird Habitat Suitability: Everglades Landscape Model Applications . 27-slide PowerPoint presentation, presented at final meeting to summarize & discuss wading bird assessment project results with the SFWMD team. (6 mb pptx)
This section links to documentation of model assumptions, inputs, and outputs for the xyz simulation runs.
Timeline of updates to this page.
Page Contents - Major headings
53 Kb, May 26, 2015 -
Summary of all Performance Measures that are used to make relative comparisons among ELM-simulated baselines and alternatives.
66 Kb, May 26, 2015 -
Details of the Wading Bird Performance Measures that are used to make relative comparisons among ELM-simulated baselines and alternatives.
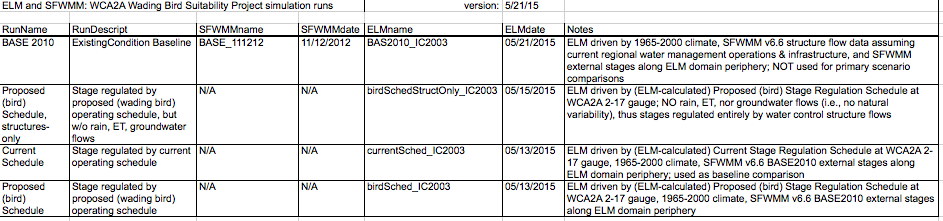
For evaluations of the WCA-2A Wading Bird Suitability Project, we use relative comparisons of the (ELM rule-based) proposed ("bird") stage regulation schedule to the (ELM rule-based) current regulation schedule.
Moreover, we provide comparisons of the (ELM rule-based) current regulation schedule to the simulation of the 2010 Existing Condition Base with all managed structure flows driven by the SFWMM v6.6.
Another simulation is provided that employs the ELM rule-based proposed schedule, but with no rainfall or ET, i.e., no natural variability and thus resulting in water depths that adhere very closely
to the regulation schedule.
1.4 Mb, May 26, 2015 - Excel (.xlsx) file containing the monthly mean flows for the WCA-2A water budgets used to generate above summary graphic (2010 Base, current Schedule, bird Schedule).
Summary of Performance Measure Results for the scenario runs.
![]()
 0.8 Mb, May 26, 2015 - All scenarios: Summary graphic of the wading bird depth and recession rate
Performance Measure differences between scenarios.
(FYI, Example-Dry-Year is 1989, Example-Wet-Year is 1994, Example-Average-Year is 1978.)
0.8 Mb, May 26, 2015 - All scenarios: Summary graphic of the wading bird depth and recession rate
Performance Measure differences between scenarios.
(FYI, Example-Dry-Year is 1989, Example-Wet-Year is 1994, Example-Average-Year is 1978.)
90 Kb xlsx file, May 26, 2015 - Excel (.xlsx) file containing the summary data table for the above monthly wading bird Performance Measure pdf graphic.
82 Kb xlsx file, May 26, 2015 - Excel (.xlsx) file containing the summary data table for the above annual wading bird Performance Measure pdf graphic.
![]() 1.4 Mb, May 26, 2015 - All scenarios: Summary graphic of daily stages at 5 gauges in WCA-2A.
1.4 Mb, May 26, 2015 - All scenarios: Summary graphic of daily stages at 5 gauges in WCA-2A.
24 Mb xlsx file, April 19, 2015 - Excel (.xlsx) file containing the daily stage data for the above stage pdf graphic.
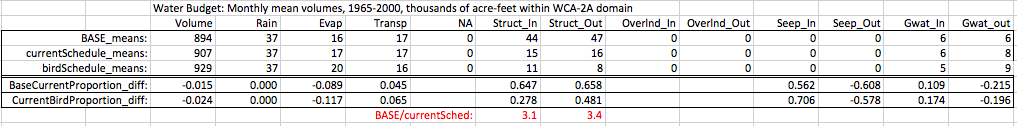
![]() 0.8 Mb, May 26, 2015 - All scenarios: Summary graphic of annual water and P input budgets in WCA-2A.
0.8 Mb, May 26, 2015 - All scenarios: Summary graphic of annual water and P input budgets in WCA-2A.
2.1 Mb xlsx file, May 26, 2015 - Excel (.xlsx) file containing the monthly/annual data for the above budget pdf graphic.
Performance Measures: Maps
Map header label-syntax: ScenarioName.TemporalStatistic.VariableName_DateOfOutput; the temporal statistics are either Raw (raw output, no summary), MeanRaw (daily mean over a 30d bin),
MeanPOS (mean over the 36yr Period Of Simulation), GeoMeanAnn (annual geometric mean), or for calculated rates - the rate between a beginning-date and ending-date (for P accumulation and peat accretion rates).
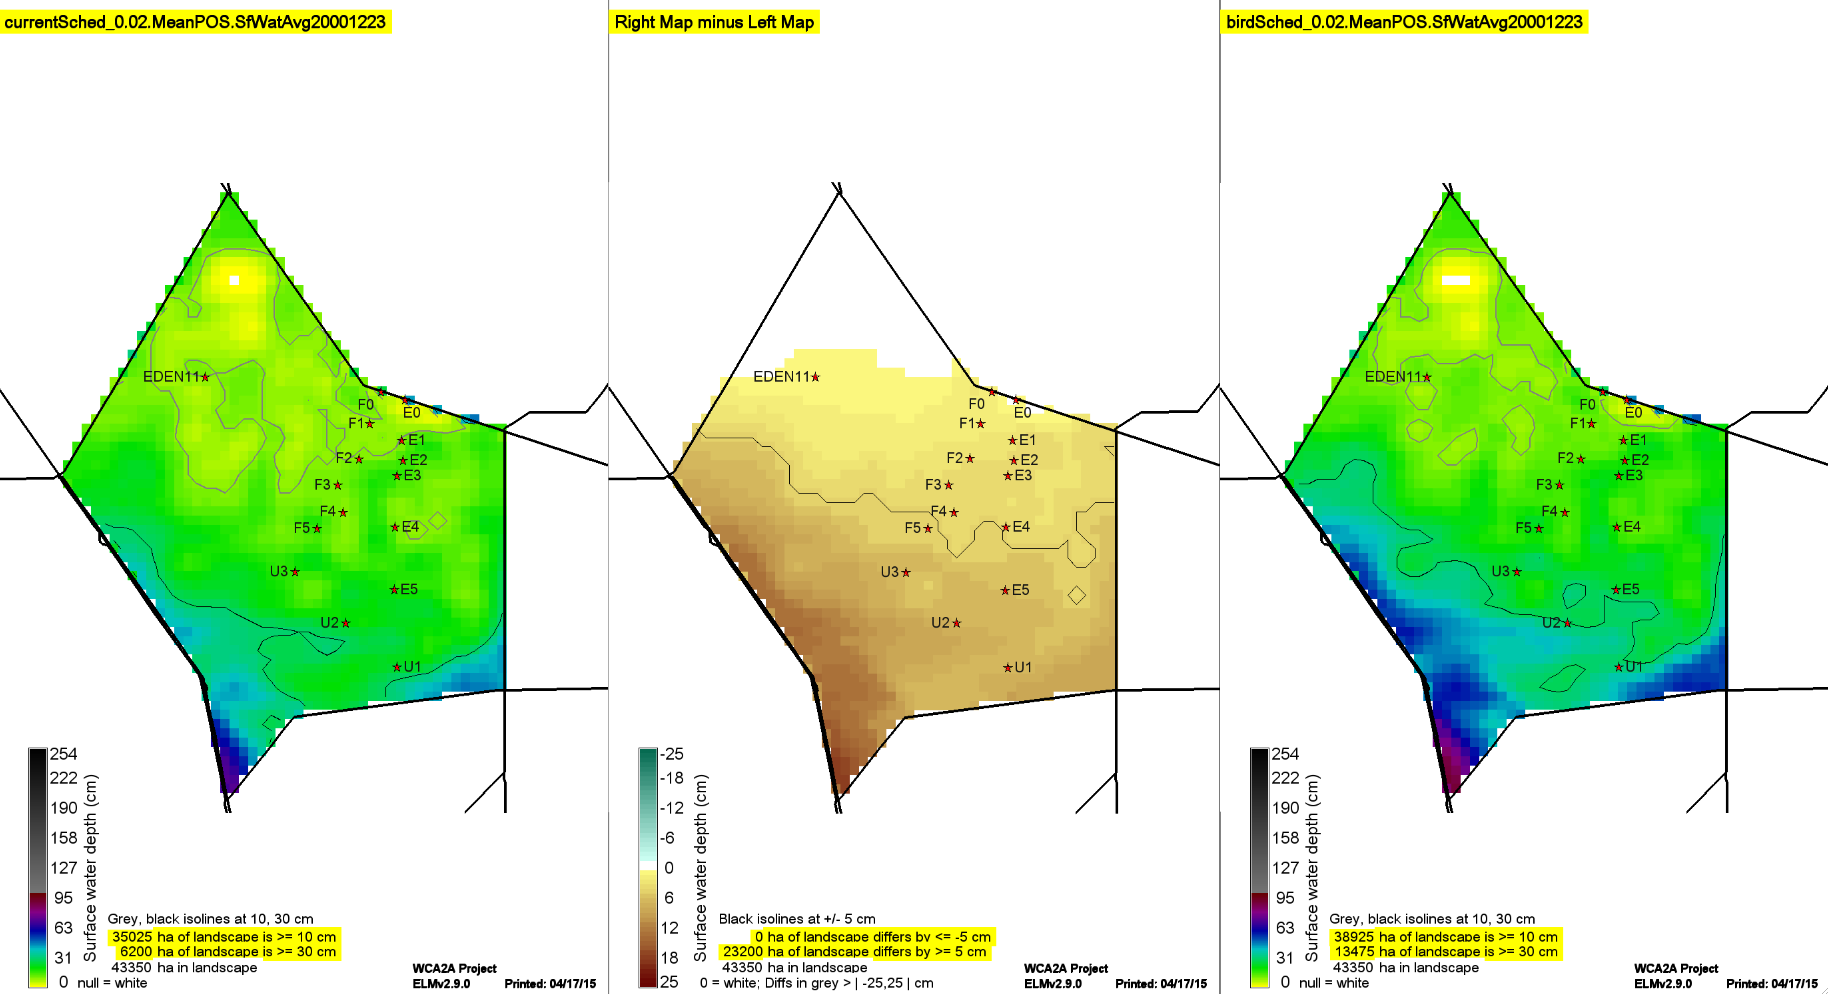 9 Mb, May 26, 2015 - Bird (proposed) Schedule vs Current Schedule: Maps of the Wading Bird Suitability Performance Measure differences between the two simulations.
37 Kb xlsx file, May 26, 2015 - Excel (.xlsx) file containing the summary data table for the above marsh areas within the various criterea/classes used in the above difference maps.
33.1 Mb, May 26, 2015 - Bird (proposed) Schedule vs Current Schedule: Maps of the Other Ecological Performance Measure differences between the two simulations.
41 Kb xlsx file, May 26, 2015 - Excel (.xlsx) file containing the summary data table for the above marsh areas within the various criterea/classes used in the above difference maps.
30.0 Mb, June 17, 2015 - Bird (proposed) Schedule vs Current Schedule: Maps of the annual geometric mean TP concentration in surface water Performance Measure differences between the two simulations.
40 Kb xlsx file, June 17, 2015 - Excel (.xlsx) file containing the summary data table for the above marsh areas within the various criterea/classes used in the above difference maps.
Raw output files (currentSched, birdSched)
 ForEverView.zip
11.4 Mb, May 28, 2015 - A zip archive of the "Raw" model output of a) the Water Depth Relative to Land Surface (RelDepPosNegAvg), and b) the Wading Bird Recession Rates (Hyd_reccAvg),
for the two simulations, in netCDF format; each netCDF file is a map-time-series of 30-day mean variable values during the 36-yr Period of Simulation.
ForEverView.zip
11.4 Mb, May 28, 2015 - A zip archive of the "Raw" model output of a) the Water Depth Relative to Land Surface (RelDepPosNegAvg), and b) the Wading Bird Recession Rates (Hyd_reccAvg),
for the two simulations, in netCDF format; each netCDF file is a map-time-series of 30-day mean variable values during the 36-yr Period of Simulation.
 EcoLandMod Projects