![]() Background |
Models |
Projects |
Publications |
People |
News
Background |
Models |
Projects |
Publications |
People |
News
![]() Background |
Models |
Projects |
Publications |
People |
News
Background |
Models |
Projects |
Publications |
People |
News
Scope of Projects
Everglades regional: Sulfer & MeHg
Everglades subregional: WCA2A Wading Bird Suitability
Florida Coastal Everglades LTER
Everglades regional: SERES project
Spain Segura Basin: Ecological Economics
Everglades regional: CERP ASR
Everglades regional: CERP Decomp
Everglades WCA-1: unique restoration
Louisiana Davis Pond: restoration prototype
Everglades regional: cal/val (ELM v. 2.8)
Everglades regional: cal/val (ELM v. 2.5)
Primary conclusions: the model works, meeting the needs associated with a variety of research and management goals.
The regional applications encompass about 10,400 km2 region of the greater Everglades system.
There are currently two regional applications: one utilizes a 500 m resolution grid (this page), and the other is at a 1 km resolution (see ELM v2.5 page).
Initial development of this finer-scaled (500 m vs. 1000 m grid) regional model was funded by the USGS Priority Ecosystem Science Program, Joint Ecosystem Modeling, in order to provide another option to 'drive' other ecological models such as those of the Across Trophic Level System Simulation (ATLSS) at the scale required by those models.
Moreover, this finer scale regional ELM application is available for evaluating other hydro-ecological responses of the Everglades landscape to alternative scenarios of water and nutrient management, as seen in the Projects: CERP Decomp Proj link.
Here we provide a brief overview of the 500-m (ELM v2.8.3) application that we released in August 2009 for formal project planning applications.
See the Models: Model download link to obtain the latest release of the Open Source Code and data,
the Publications link for a recent journal article (Fitz et al. 2011) on applying this model,
and the Model Documentation Report that fully describes the model, data, and model performance.
Note that an Independent Expert Panel reviewed the previous ELM v2.5 (1 km grid resolution) regional application, indicating that the model should be used for Everglades restoration
planning - their 2007 report is available here.
The figures below shows some of the hydrologic and water quality performance assessments of the model (which is better than the performance of the ELM v2.5 application at 1-km resolution, which an independent review panel accepted for use in Everglades restoration planning).
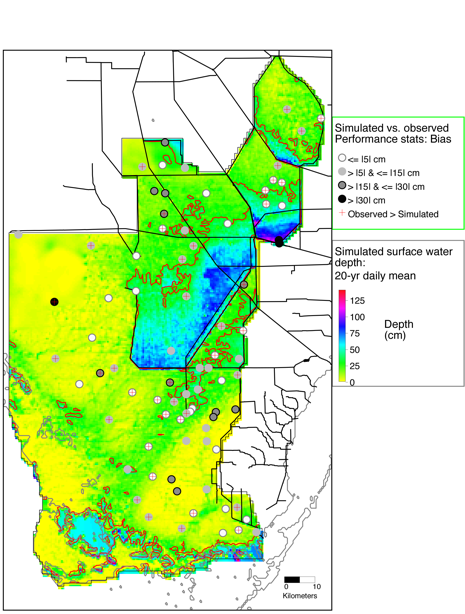
Above figure shows statistical bias in ELMv2.8.3 predictions of observed water stage elevations in marsh locations from 1981-2000. Background map is the simulated mean daily surface water depth above land surface elevation in the marsh from 1981-2000; the red contour line is the 30 cm depth isoline.
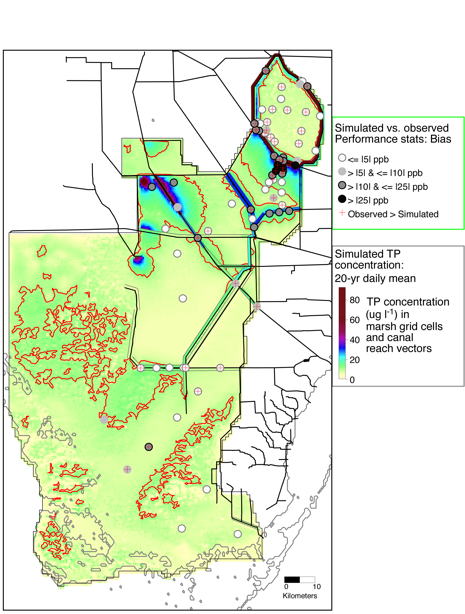
Above figure shows statistical bias in ELMv2.8.3 predictions of observed surface water total phosphorus concentrations in marsh and canal locations from 1981-2000. Background map is the simulated mean daily surface water total phosphorus concentrations in the marsh and canals from 1981-2000; the red contour line is the 10 ug l-1 isoline. Canal widths are exaggerated in order to display concentration colors, with the location offset relative to any existing levee.
While rigorous comparisons of simulated to observed data at points along gradients are important in demonstrating model performance, 2D and 3D animations provide a rich amount of information on the model capabilities.
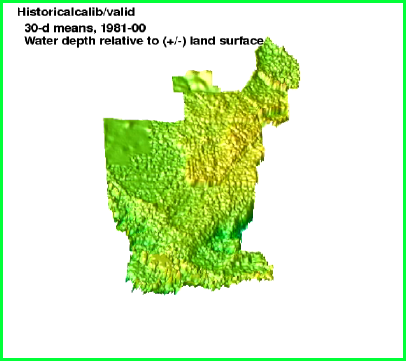
Quicktime movie (MPEG 6.8 mb) ELMreg500 v2.8 simulated (positive/negative) water depth relative to land elevation, under historical climate and water management 'drivers'. Each frame is a 30-d mean value of the positive or negative depth of the water table relative to local land elevation, spanning the 243 intervals of 1981-2000.
 EcoLandMod Projects