![]() Background |
Models |
Projects |
Publications |
People |
News
Background |
Models |
Projects |
Publications |
People |
News
![]() Background |
Models |
Projects |
Publications |
People |
News
Background |
Models |
Projects |
Publications |
People |
News
Scope of Projects
Everglades regional: Sulfer & MeHg
Everglades subregional: WCA2A Wading Bird Suitability
Florida Coastal Everglades LTER
Everglades regional: SERES project
Spain Segura Basin: Ecological Economics
Everglades regional: CERP ASR
Everglades regional: CERP Decomp
Everglades WCA-1: unique restoration
Louisiana Davis Pond: restoration prototype
Everglades regional: cal/val (ELM v. 2.8)
Everglades regional: cal/val (ELM v. 2.5)
Primary conclusions from this completed project: water quality is not a constraint on the hydrologic restoration components of the CERP Decomp Phase 1 project.
The target audience for this page is the Comprehensive Everglades Restoration Plan (CERP)
"Water Conservation Area 3 Decompartmentalization & Sheet Flow Enhancement - Phase 1" (Decomp)
Project Development Team (PDT), comprised of numerous technical staff representing Federal, Tribal, State and Local government agencies.
Thus, we do not attempt to describe the goals of the Decomp Project itself, nor the many documents describing the work of the PDT towards the Decomp Project development.
For such information on the Decomp Project itself, please see the above Decomp web page .
This page provides the PDT with results of their requests to provide ELM simulation results under the different Baseline and Alternative planning scenarios.
The Model Documentation report on the ELM v2.8.4 historical (calibration/validation) performance assessment
(including data, code, model performance assessment, and user's guide) is found in the Publications link.
Note: That report is separate from the documentation of the ELM applications that supported analysis of Decomp restoration alternatives, which is the topic of this web page.
Here we document the assumptions and results of applying ELM v2.8.4 to aid in future project planning for the
Decomp project, with the U.S. Army Corps of Engineers providing funding support for the ELM applications and refinements.
 10.2 mb - Fitz, H.C. June 20, 2011.
Everglades Landscape Model: Initial Results for DECOMP PIR 1 Phase 1 Base Runs. 20-slide PowerPoint presentation, refers to "Performance Measures", which should read "Performance Indicators" for this project.
Note that only limited examples of the model results are contained in the PowerPoint (pdf) file; group was shown multiple Performance Indicator graphics using other software, as noted in the presentation.
10.2 mb - Fitz, H.C. June 20, 2011.
Everglades Landscape Model: Initial Results for DECOMP PIR 1 Phase 1 Base Runs. 20-slide PowerPoint presentation, refers to "Performance Measures", which should read "Performance Indicators" for this project.
Note that only limited examples of the model results are contained in the PowerPoint (pdf) file; group was shown multiple Performance Indicator graphics using other software, as noted in the presentation.
Pending the development of a final report for the results from the Project, this section links to documentation of model assumptions, inputs, and outputs for Decomp
Base and Alternative simulation runs.
The various Adobe Acrobat "pdf's", and associated text descriptions, will be integrated into an overall documentation report on the results of applying the ELM to the Decomp project.
(See the WCA-1 project
Final Report for an example from a previous ELM application).
Timeline of updates to this page.
Page Contents - Major headings
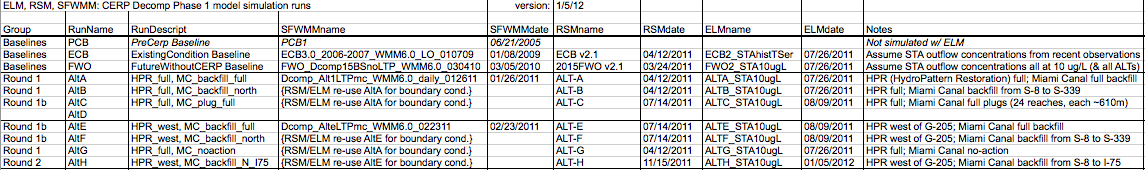
0.4 Mb - Summary table of input data for simulations.
1.2 Mb - Input map data that are common to all Decomp project simulations.
Note: Prior to development of a full documentation report for these ELM applications for the Decomp Project, please see the above "Summary table of input data for simulations"
and the related water quality assumptions found in the basin-wide budget summary output tables in the "Results: Baseline runs" section below.
For detailed hydrologic assumptions used by the RSM and SFWMM (whose managed water control structure flows drive these ELM simulations),
please see the relevant documentation for the applications of those models (i.e., in the "CERPzone" repository).
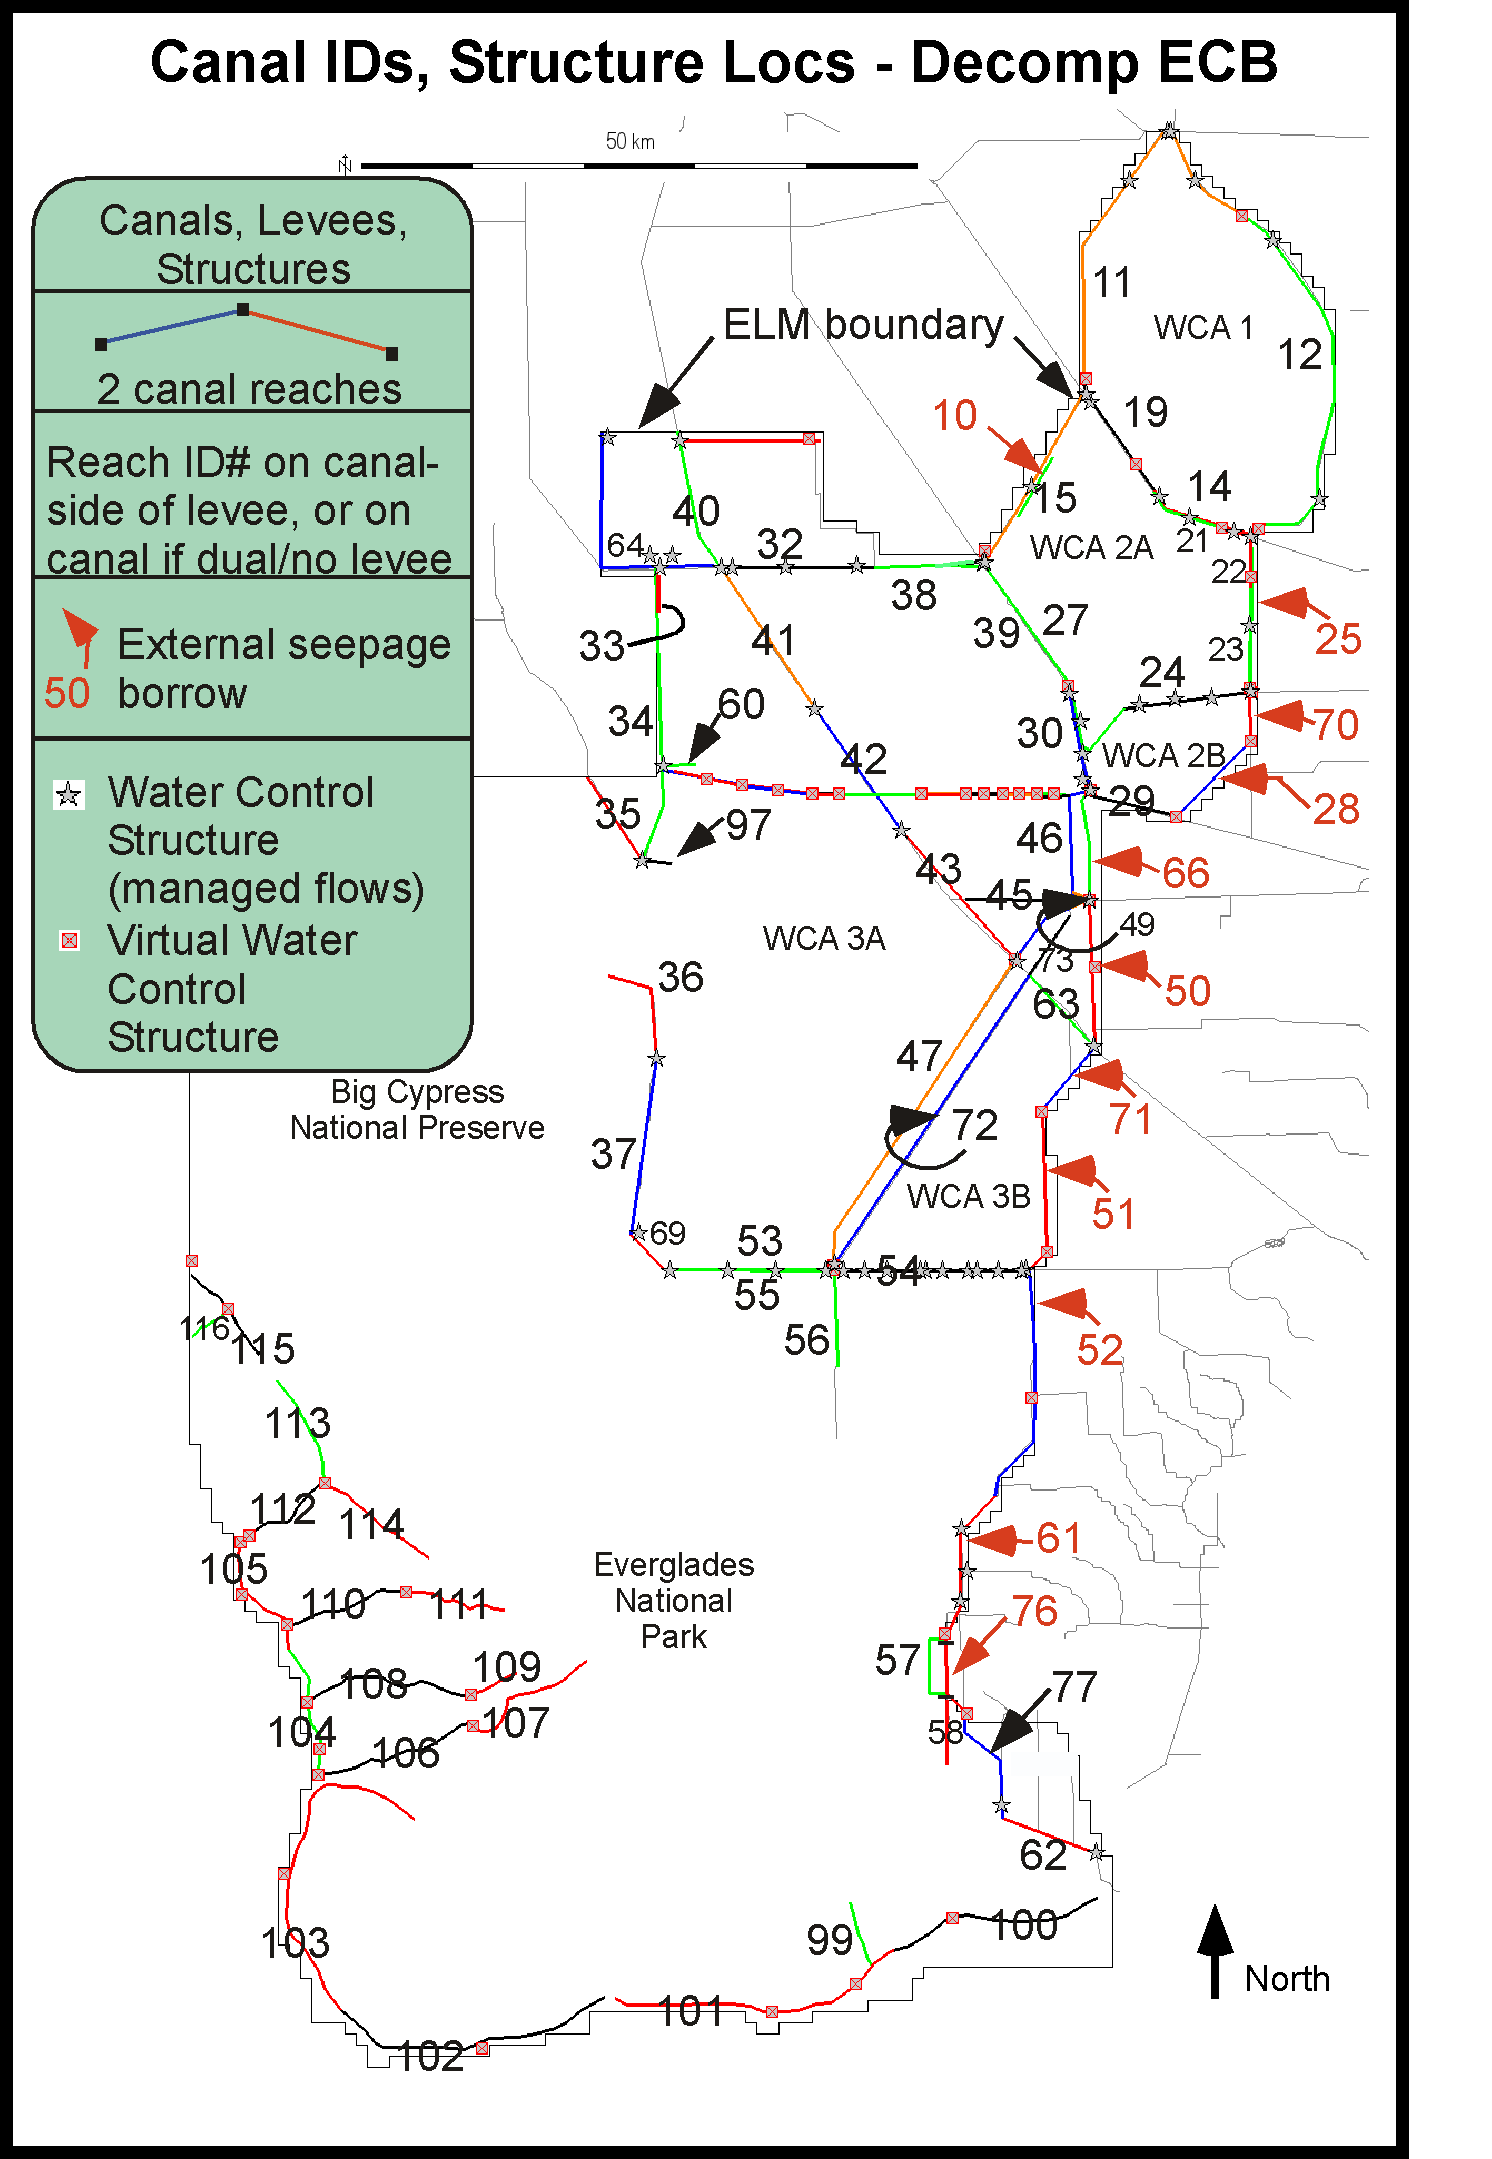
Water management infrastructure data
0.1 Mb, July 27, 2011 - ECB: Canal/levee and water control structure map (ECB2_STAhistTSer run).
9.3 Mb, July 27, 2011 -
ECB: Water control structure attributes, including into-domain constituent (P, Cl) inflow concentrations (database export graphic) (ECB2_STAhistTSer run).
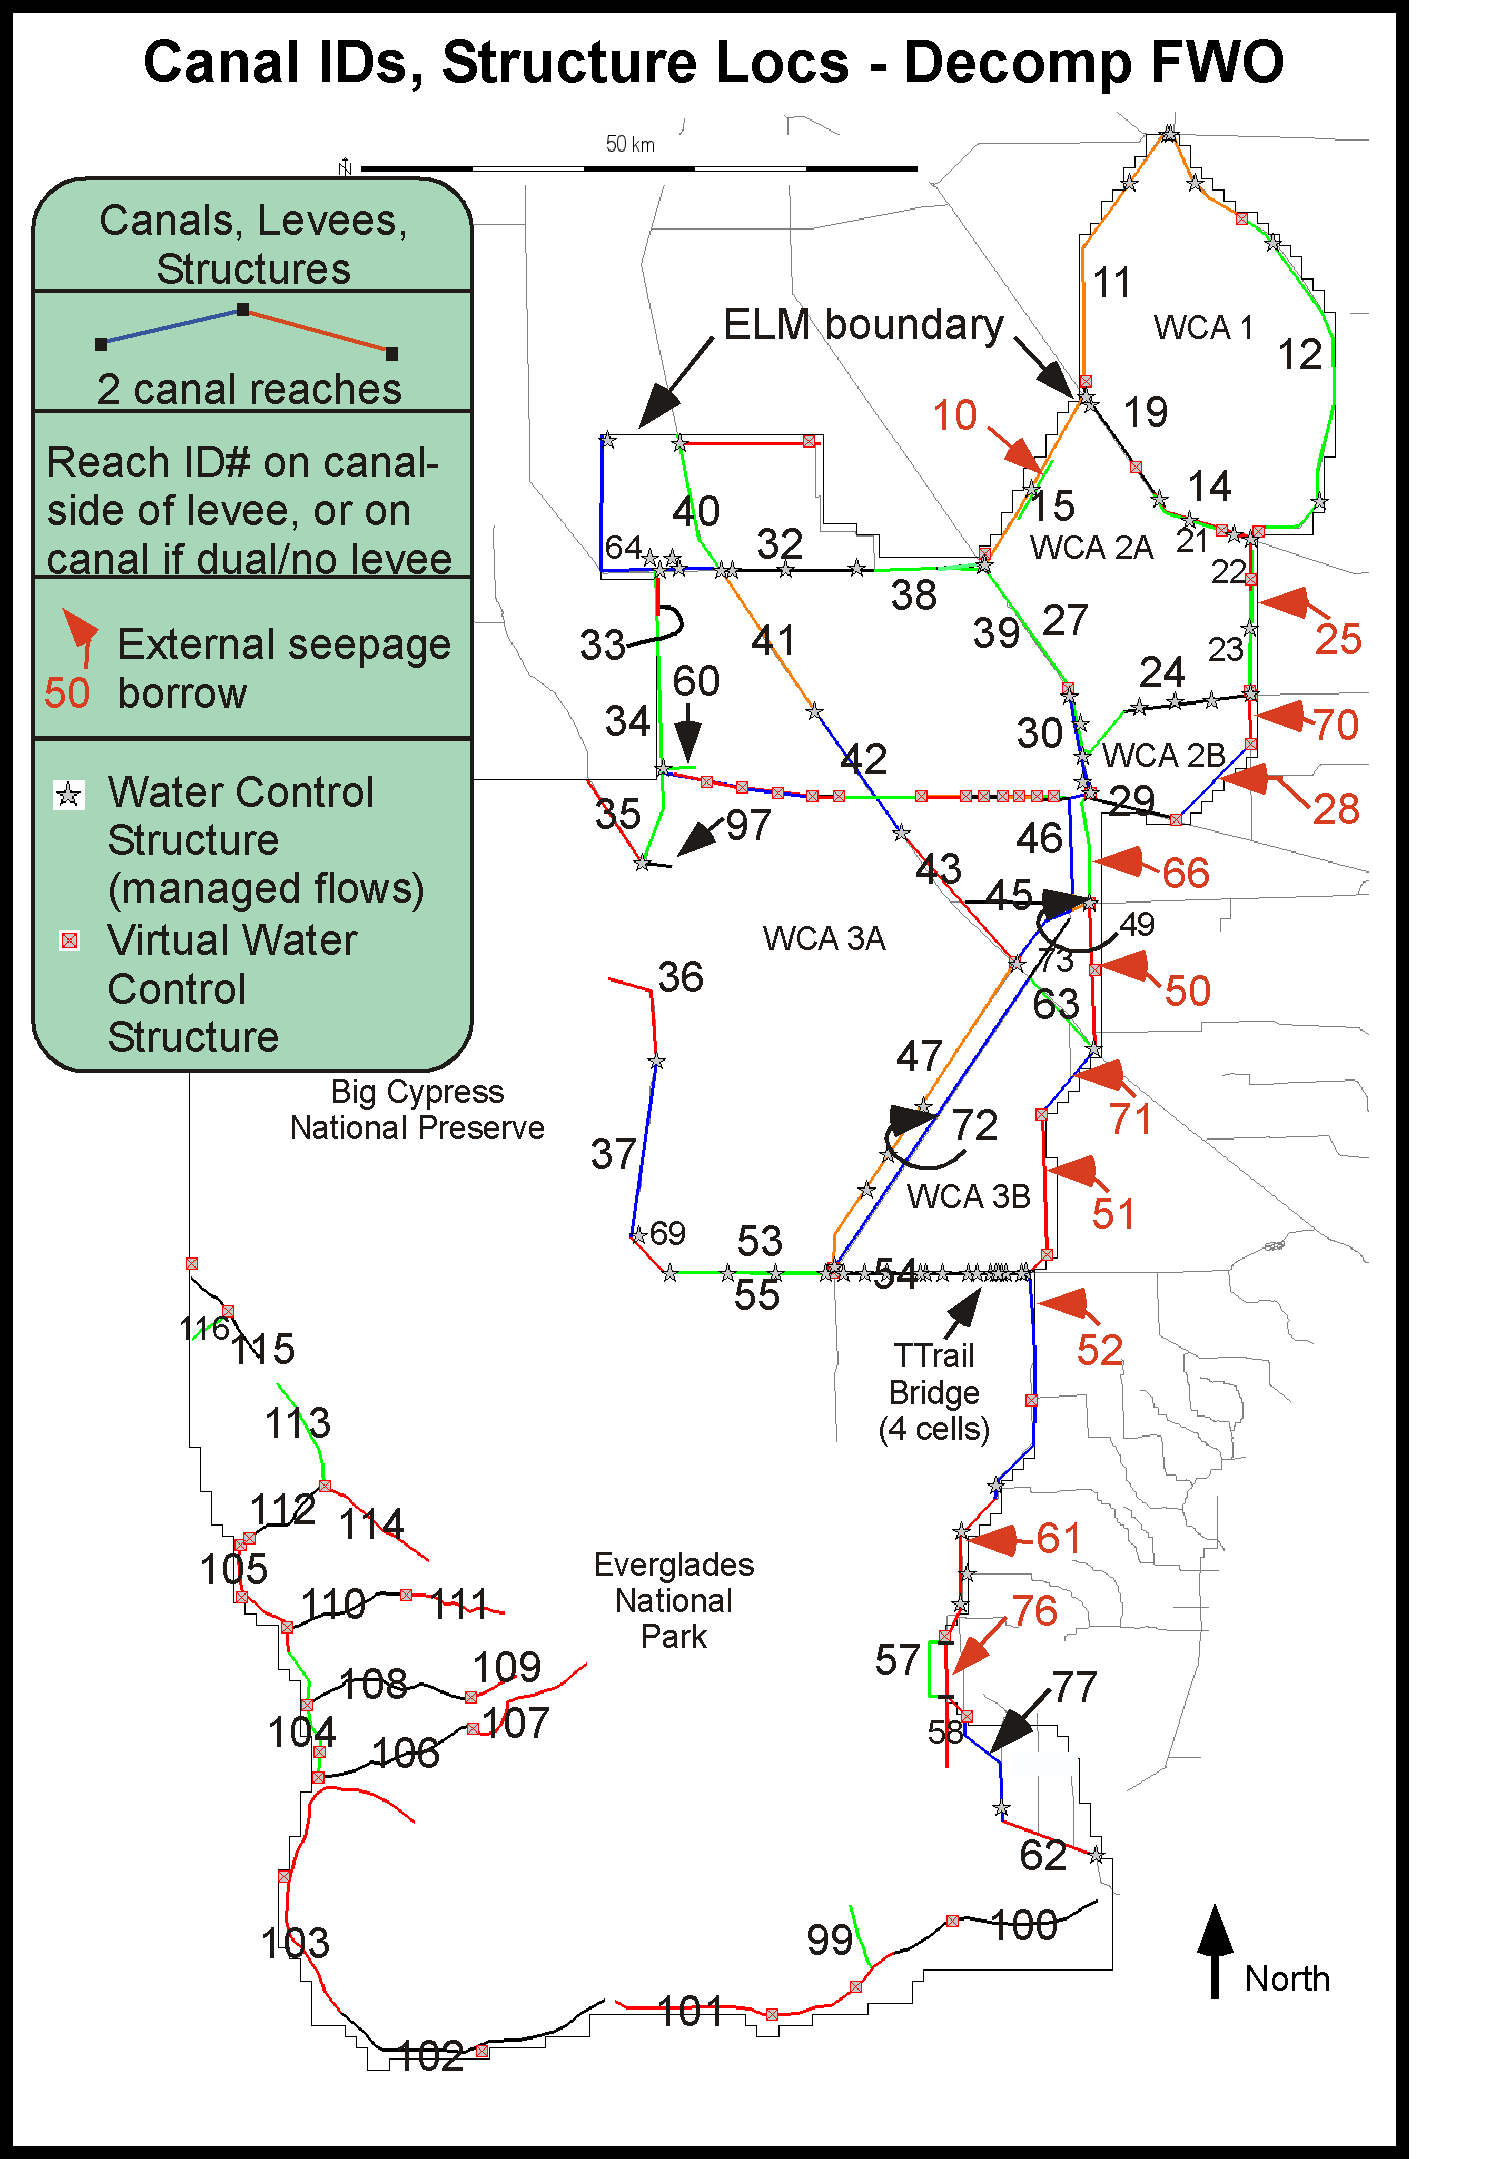
0.1 Mb, July 27, 2011 - FWO: Canal/levee and water control structure map (FWO2_STA10ugL run).
9.3 Mb, July 27, 2011 - FWO:
Water control structure attributes, including into-domain constituent (P, Cl) inflow concentrations (database export graphic) (FWO2_STA10ugL run).
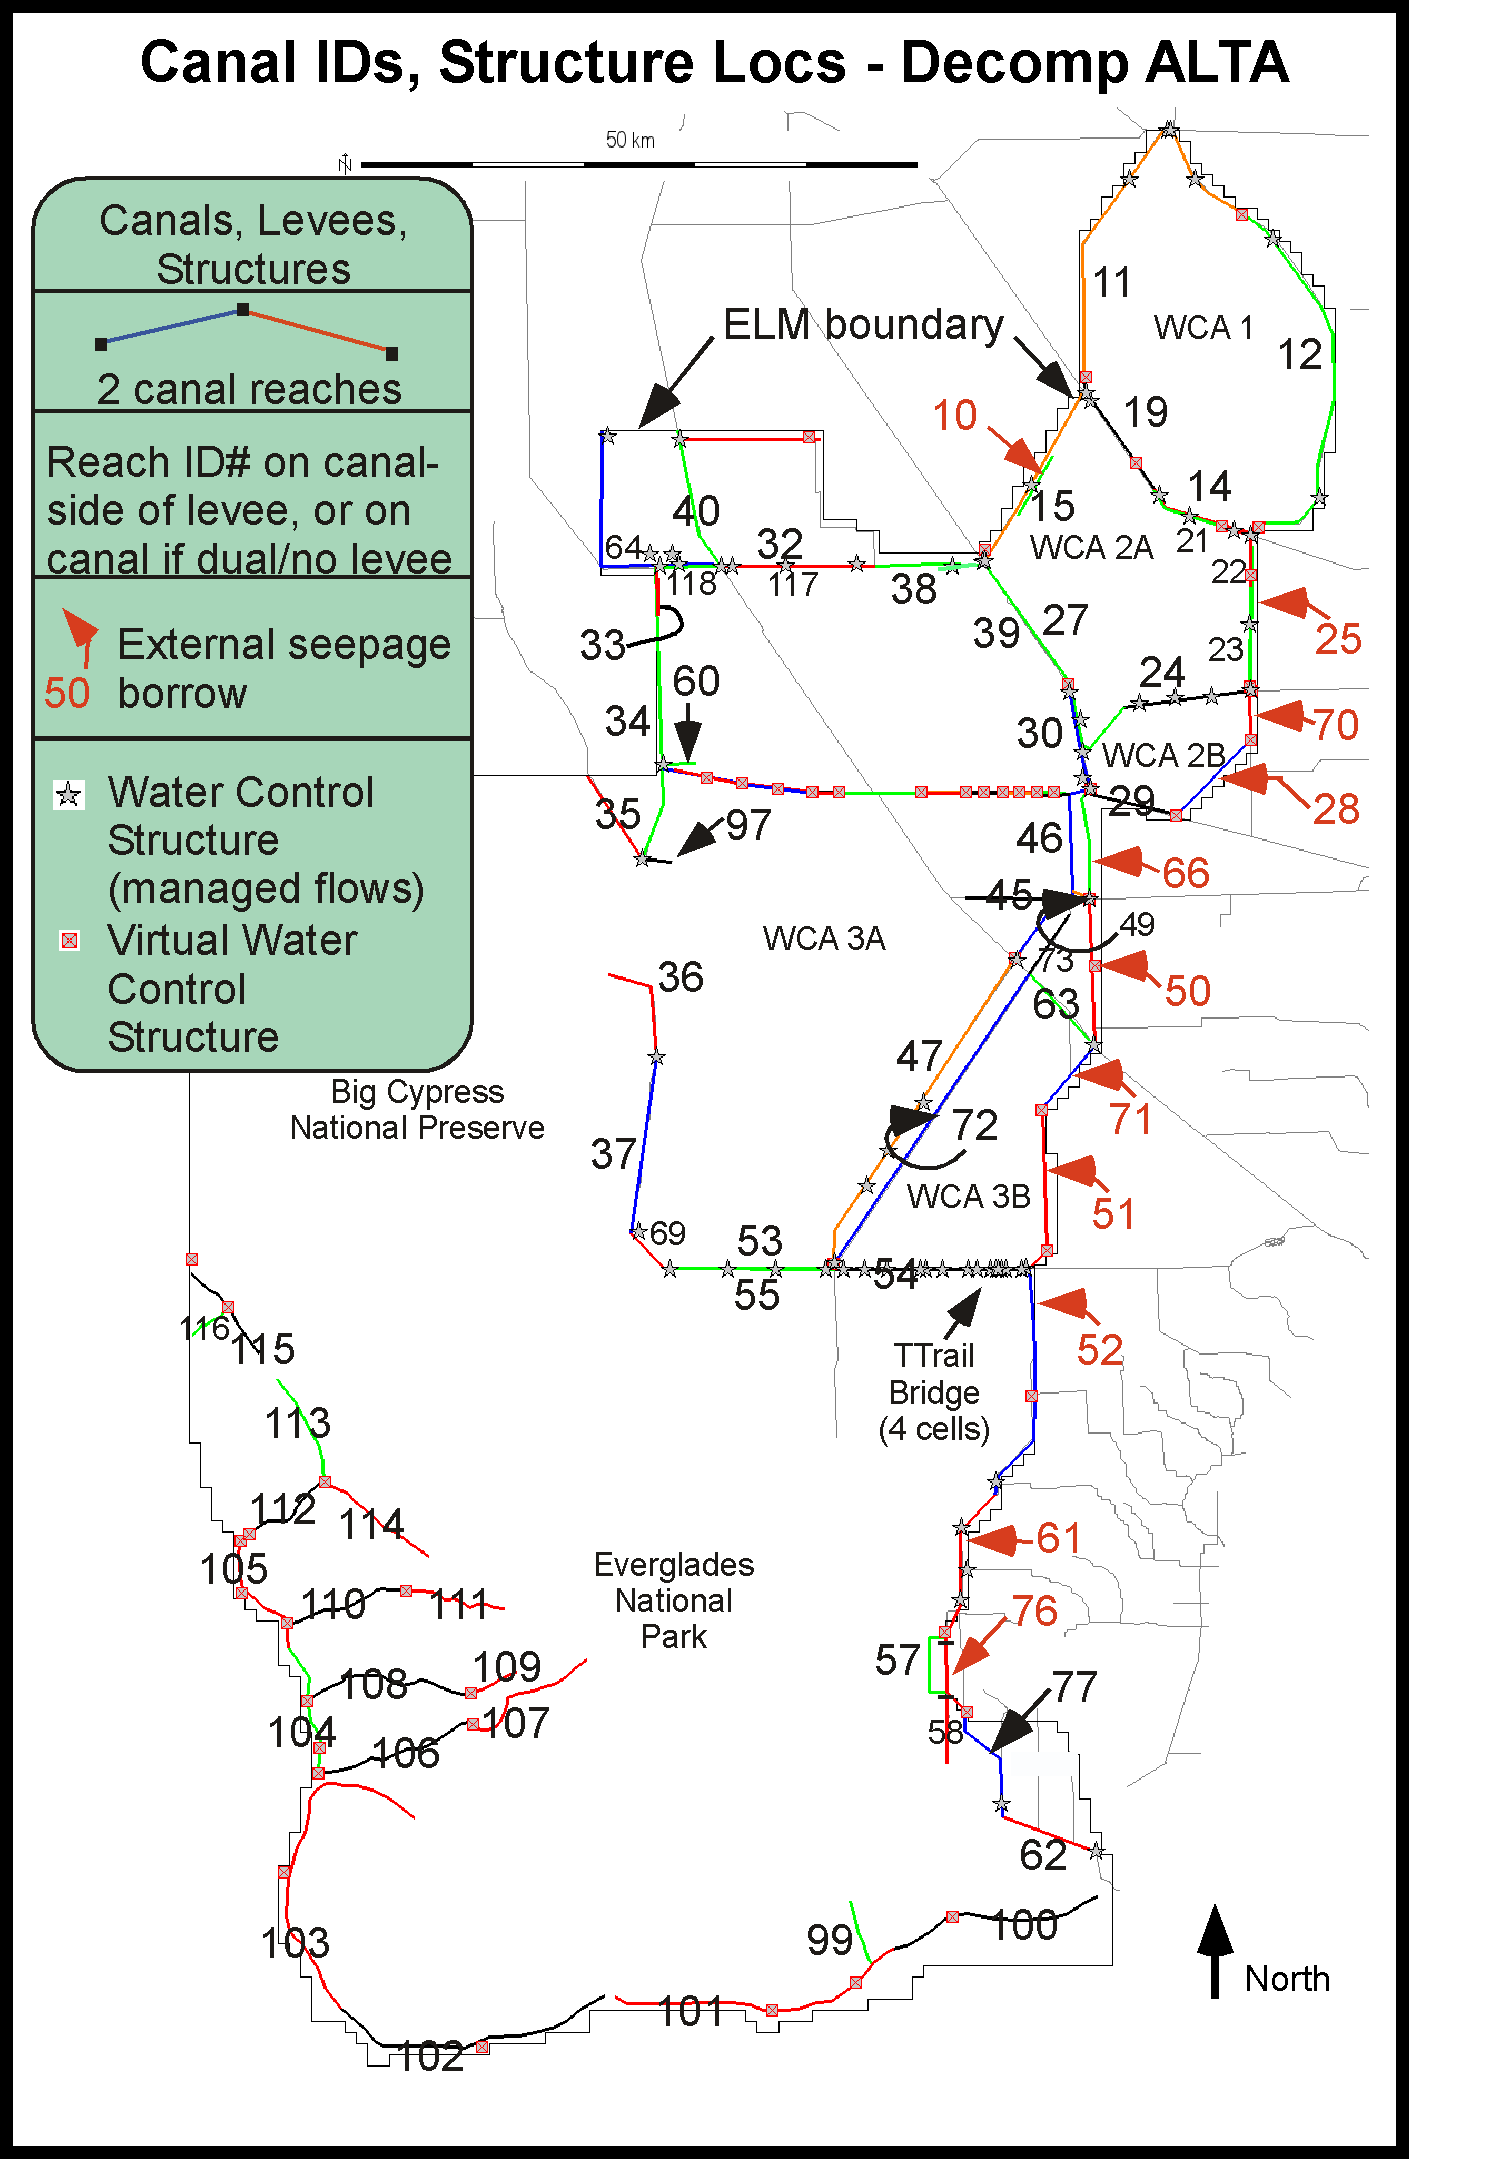
0.1 Mb, July 27, 2011 - ALTA: Canal/levee and water control structure map.
9.7 Mb, July 27, 2011 - ALTA:
Water control structure attributes, including into-domain constituent (P, Cl) inflow concentrations (database export graphic).
0.1 Mb, July 27, 2011 - ALTB: Canal/levee and water control structure map.
9.4 Mb, July 27, 2011 - ALTB:
Water control structure attributes, including into-domain constituent (P, Cl) inflow concentrations (database export graphic). (Same as ALTA, except has "virtual structure" (VS3A7) linking southern segment of Miami Canal (#43) to L-67A canal (#47)).
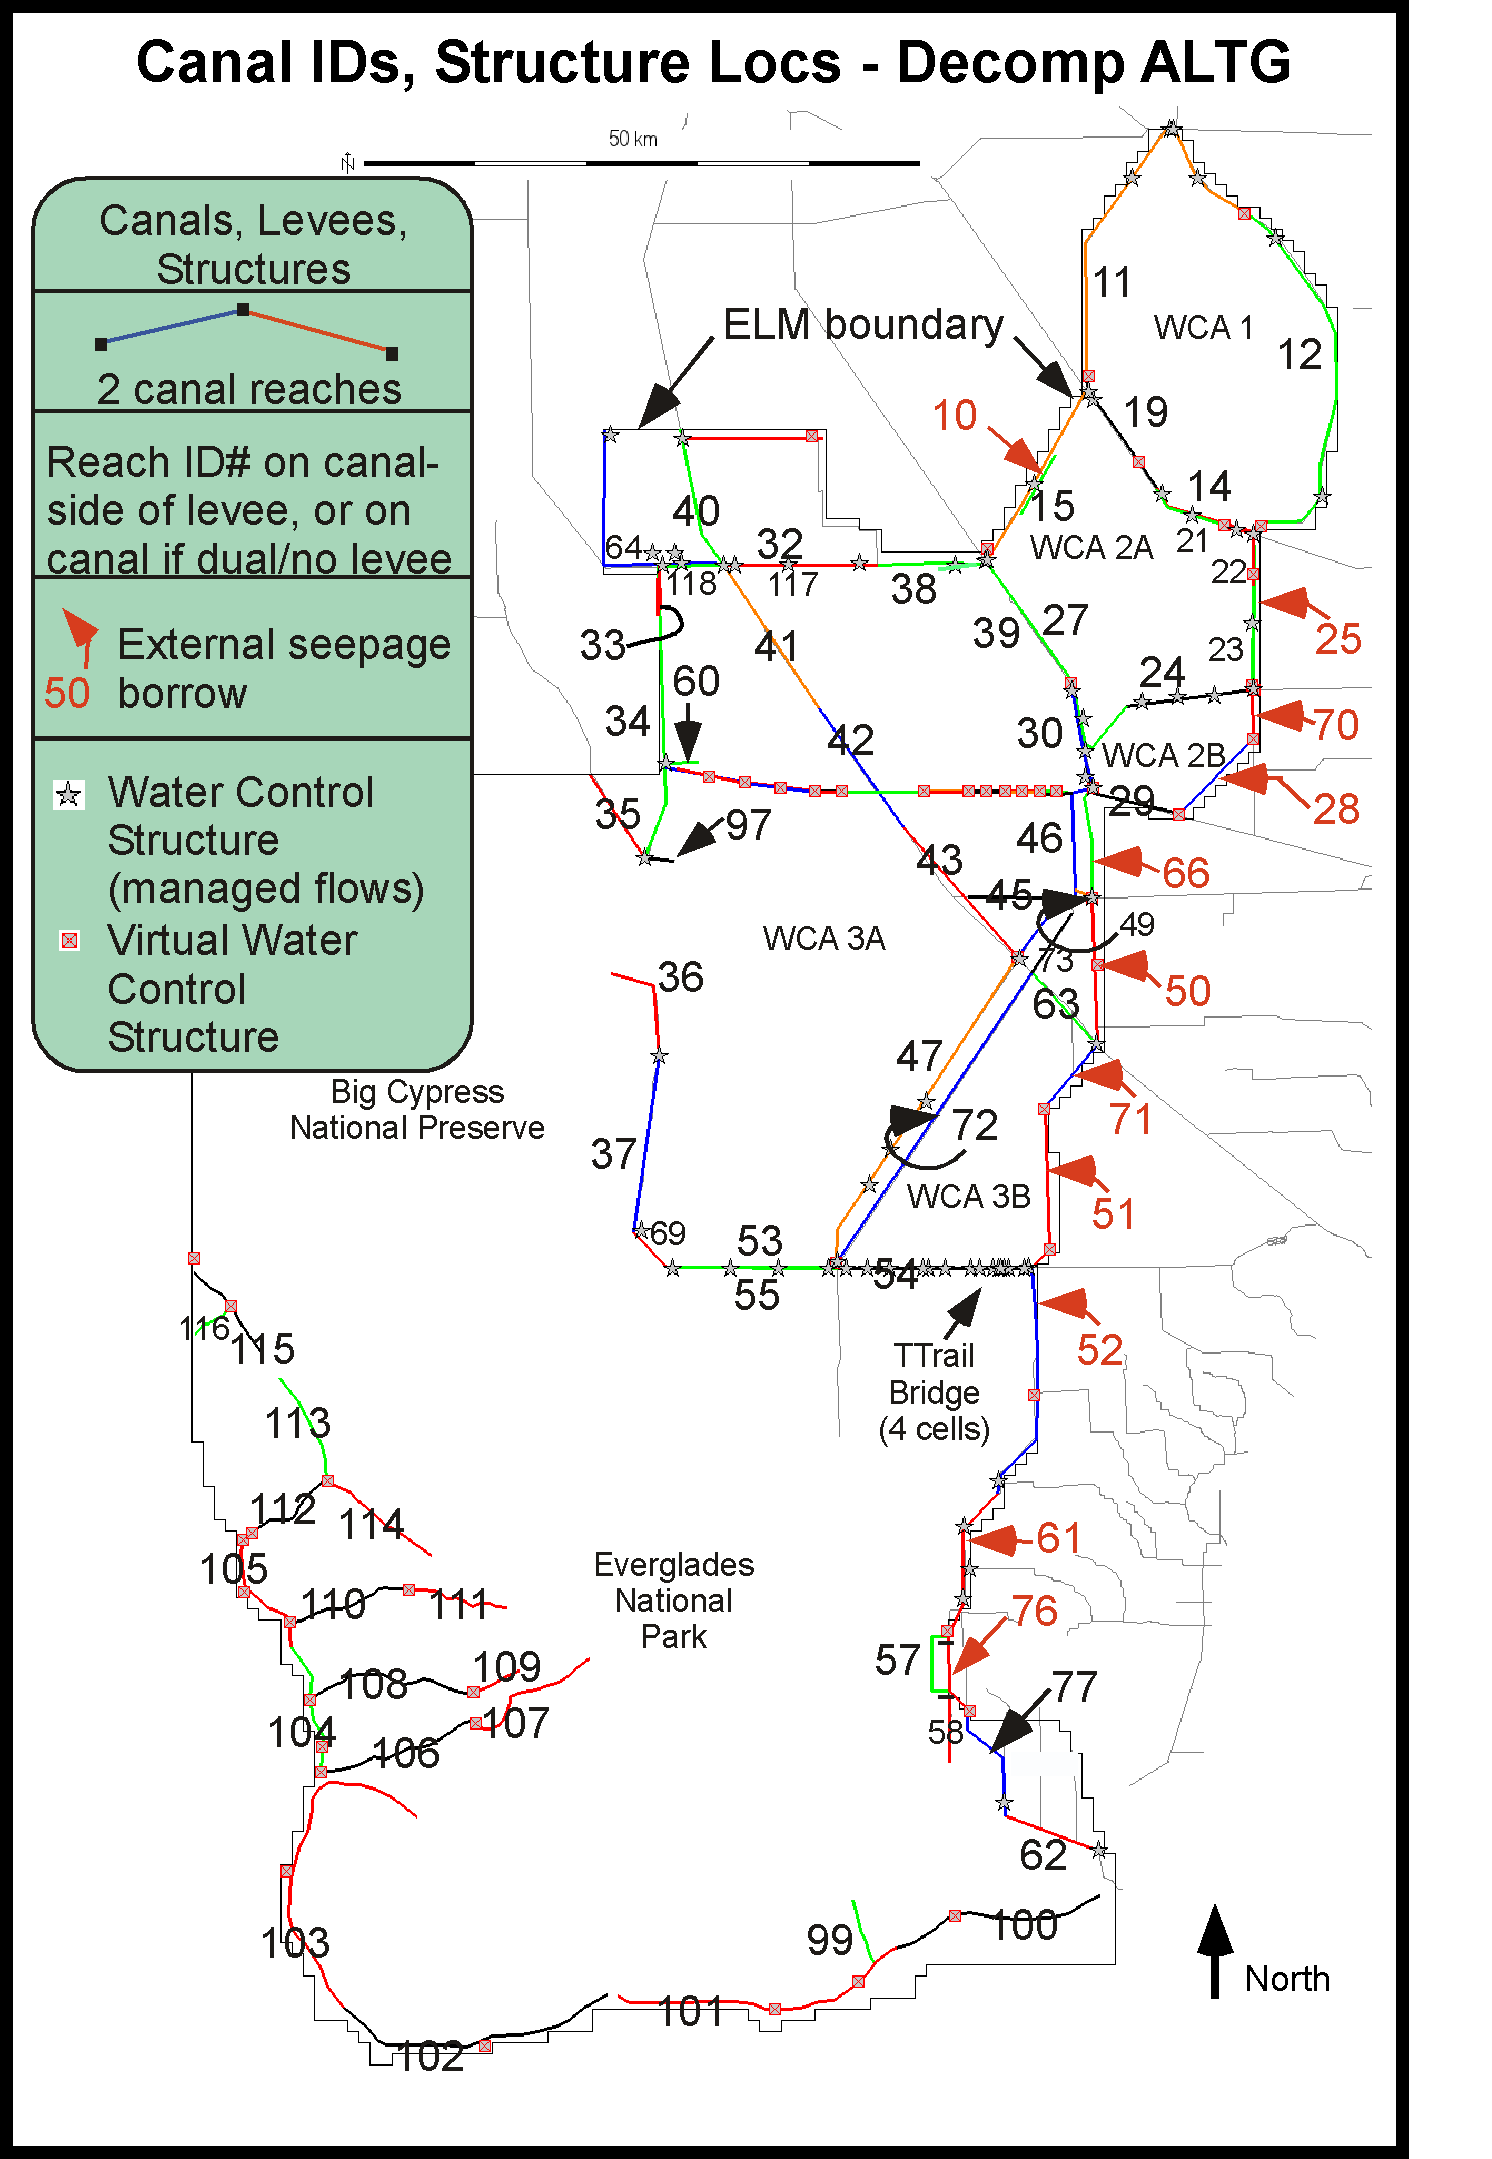
0.1 Mb, July 27, 2011 - ALTG: Canal/levee and water control structure map.
9.4 Mb, July 27, 2011 - ALTG:
Water control structure attributes, including into-domain constituent (P, Cl) inflow concentrations (database export graphic). (Same as ALTB).
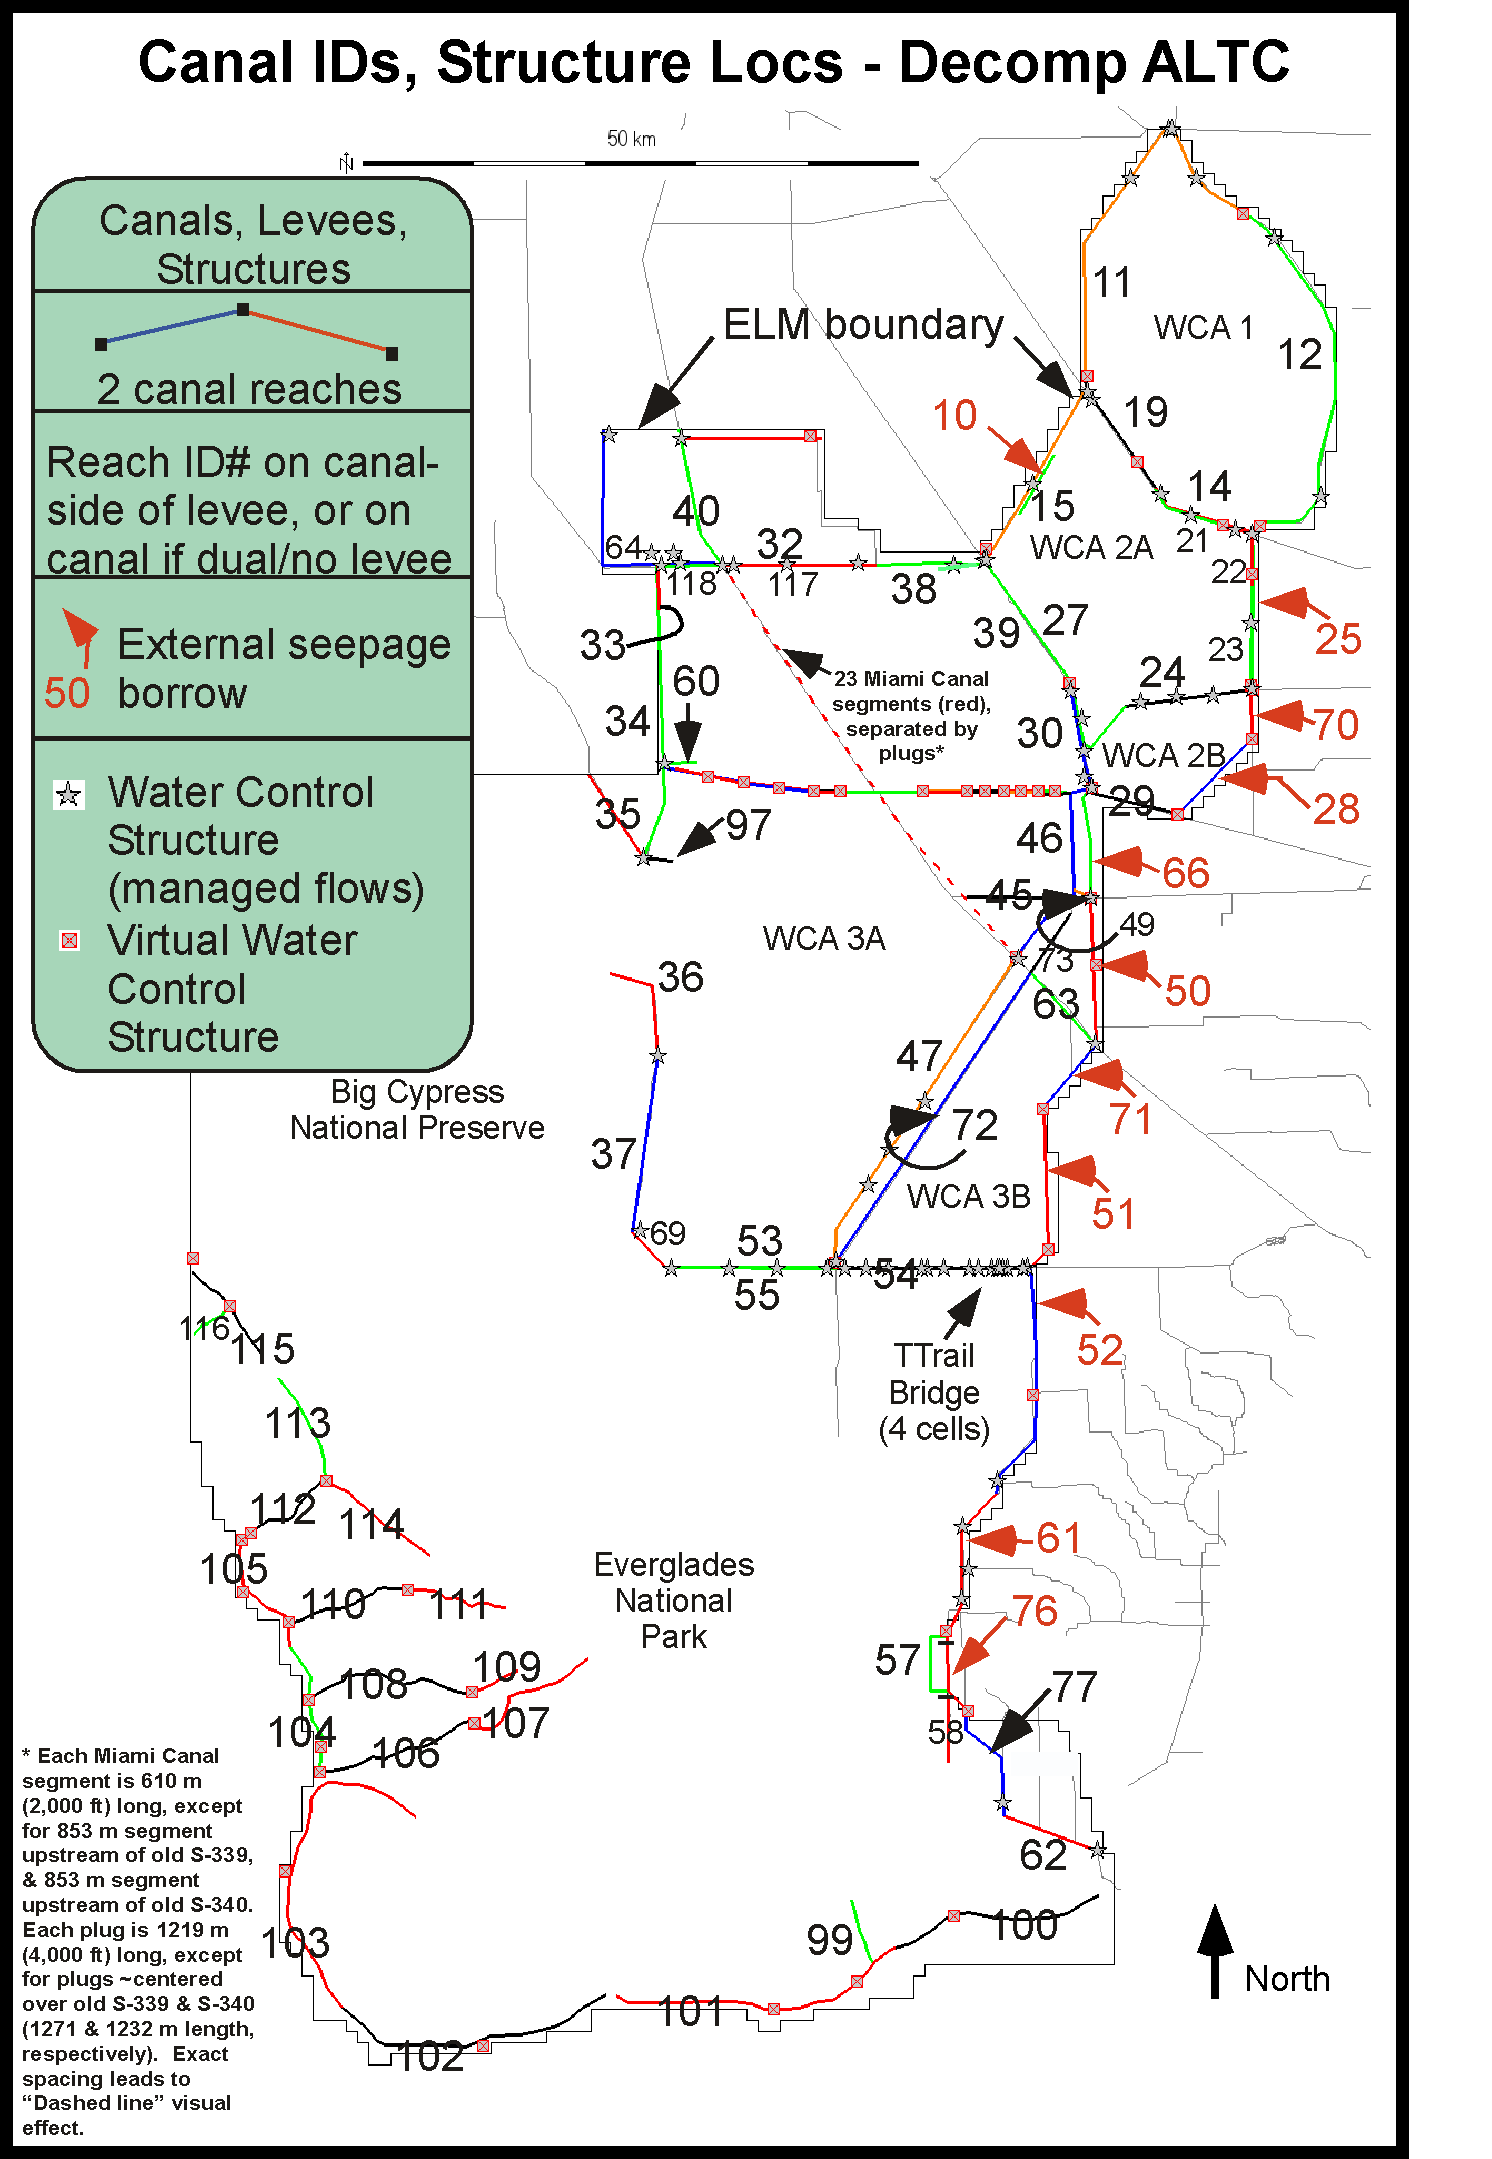
0.1 Mb, August 9, 2011 - ALTC: Canal/levee and water control structure map.
ALTC: Water control structure attributes are identical to ALTA; file not provided.
ALTE: Canal/levee and water control structure map identical to ALTA; file not provided (reach #38 active, but unused in managed flows).
9.6 Mb, August 9, 2011 - ALTE:
Water control structure attributes, including into-domain constituent (P, Cl) inflow concentrations (database export graphic). (Same as ALTA, except ALTE does not have ST3NEA).
ALTF: Canal/levee and water control structure map identical to ALTB; file not provided (reach #38 active, but unused in managed flows).
ALTF: Water control structure attributes are same as ALTB, except ALTF does not have ST3NEA; file not provided.
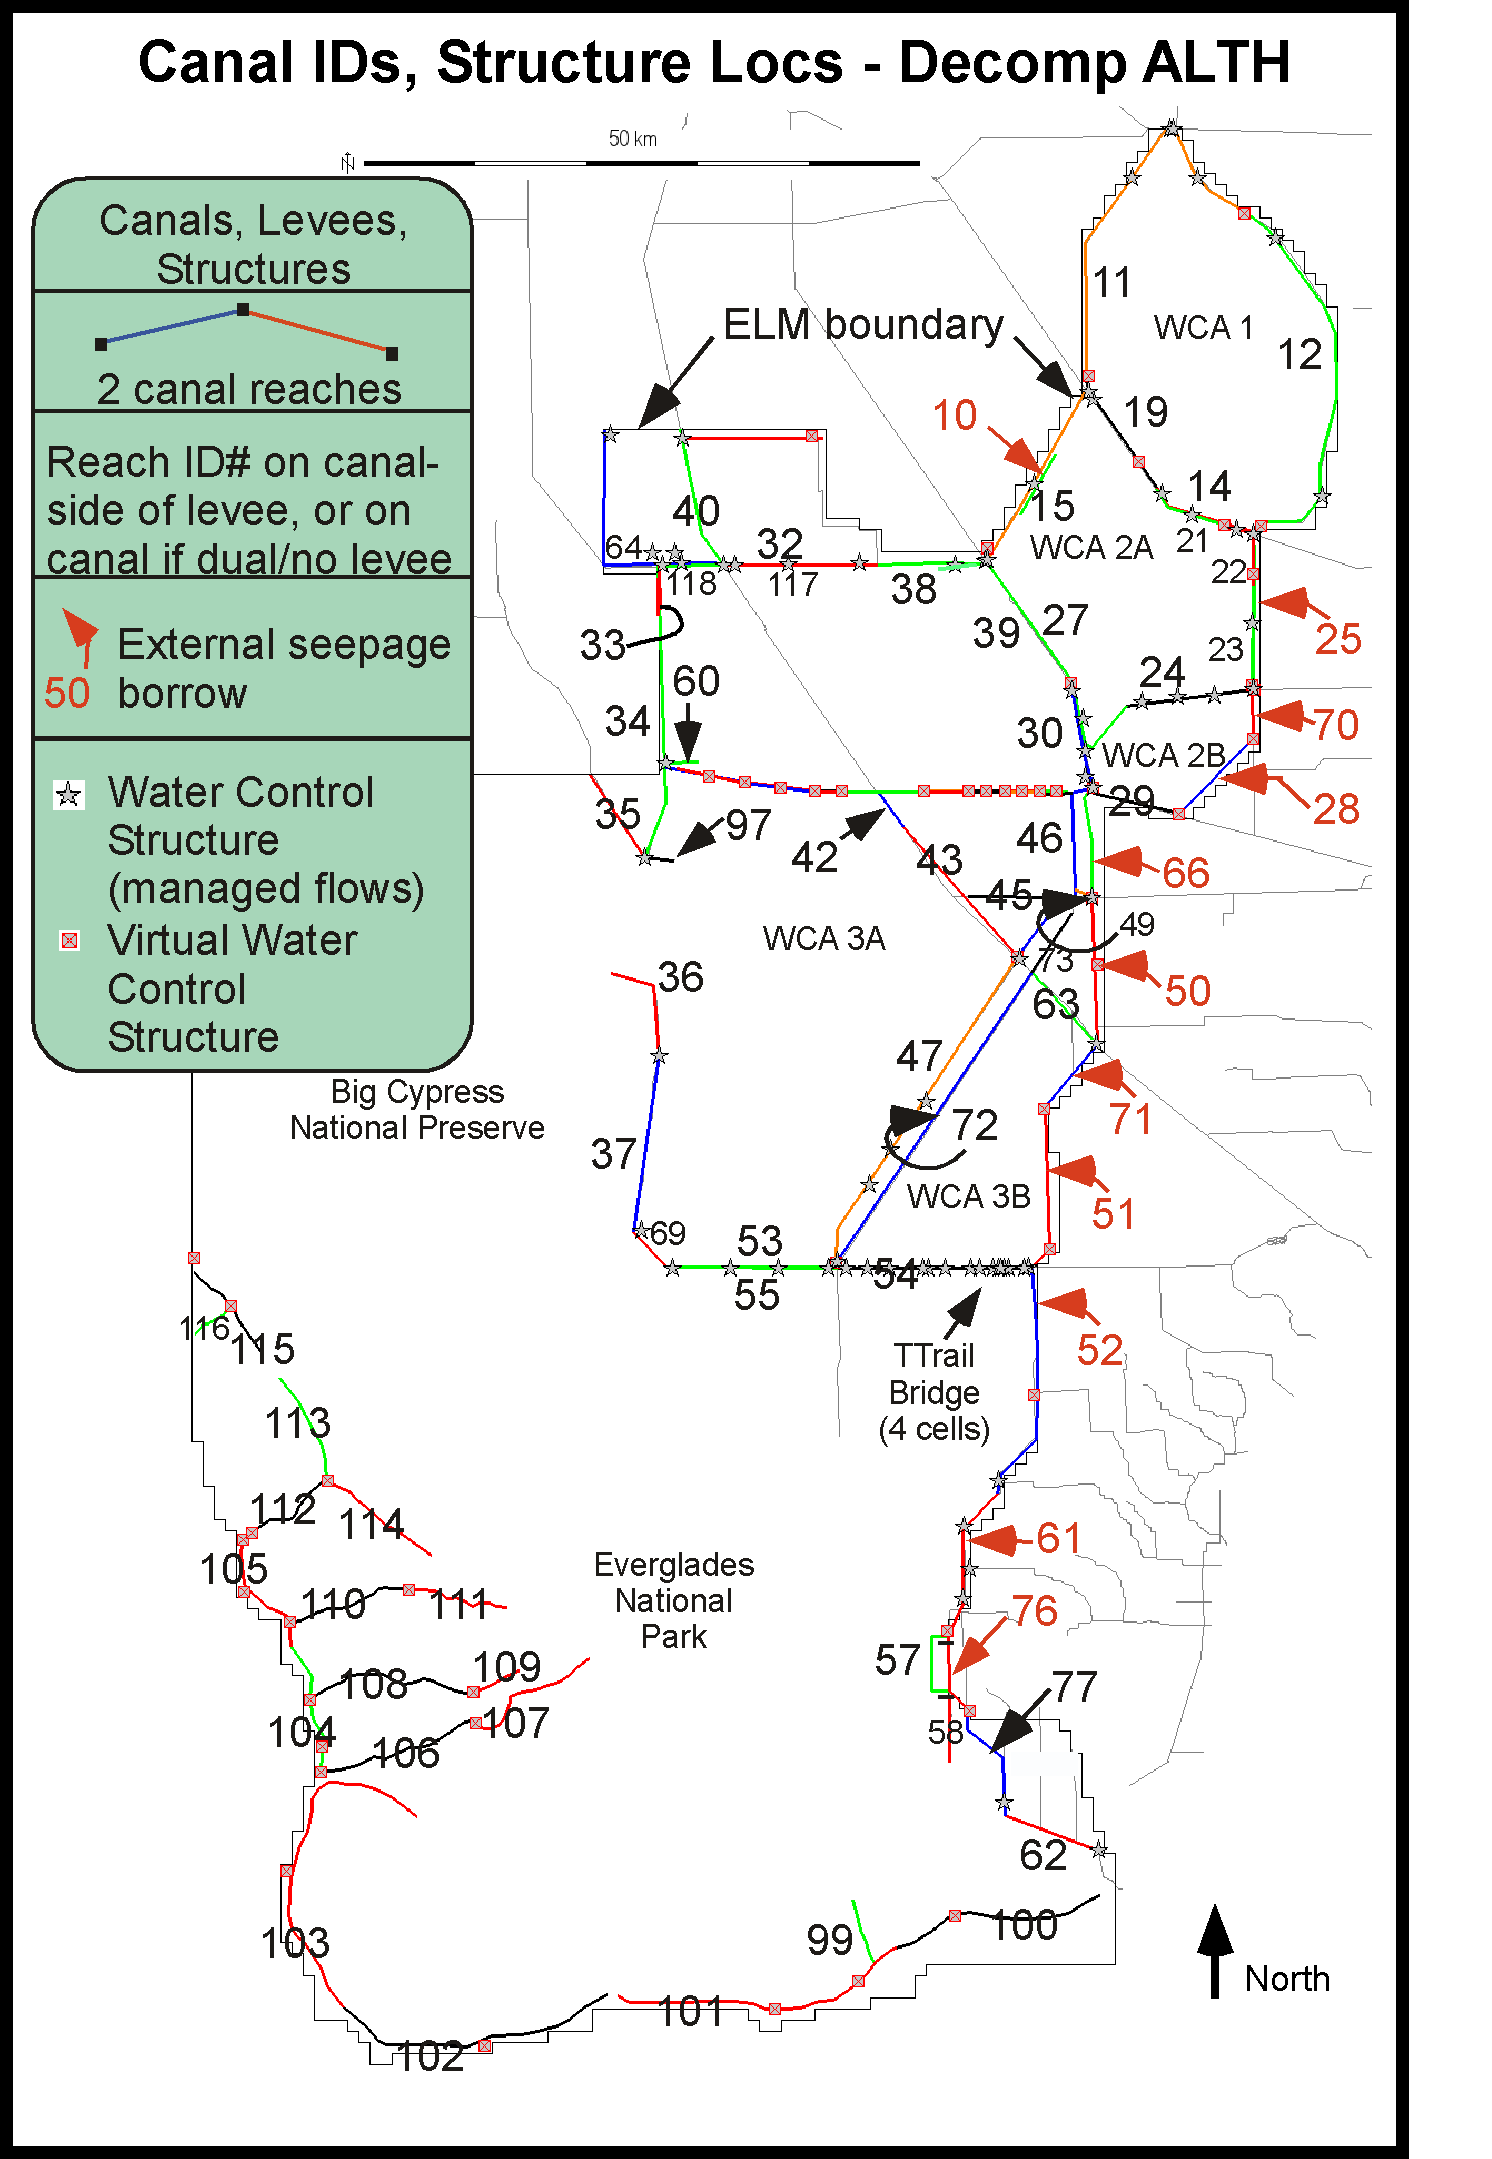
0.1 Mb, Jan 5, 2012 - ALTH: Canal/levee and water control structure map (reach #38 active, but unused in managed flows).
ALTH: Water control structure attributes are same as ALTF; file not provided.
Performance Indicators are quantitative metrics used to make relative comparisons among baseline and alternative simulations. (The term Performance Measure is not used here, as the ELM simulations are currently being used primarily to evaluate any potential water quality constraints on the Decomp project planning).
0.1 Mb, Sep 1, 2011 -
Summary table of the Performance Indicator metrics that are used to make relative comparisons among ELM-simulated baselines and alternatives.
Includes description of the Performance Indicator, and guidance on their use and interpretation.
(These Performance Indicators were developed by the Decomp PDT members in spring 2011, based on RECOVER Performance Measures and related documents).
As indicated above, the two future-baseline runs used for these evaluations are the Existing Condition Base (ECB) and the Future WithOut Project (FWO) Base.
Differences between the two baseline runs can be found in marsh areas that are external to the sub-region that will be influenced by the Decomp project, due to the different regional hydrologic and nutrient assumptions associated with the two future baseline simulations.
To help evaluate the potential water quality constraints on Decomp planning, in the "Results: Alternative scenario runs" section (below this section on Baseline results) we provide ELM-comparisons of the Decomp Planning Alternatives relative to the FWO baseline (and not the ECB)
within the Decomp footprint/domain.
However, in order to provide the Decomp PDT with a better understanding of the use of ELM in making relative comparisons, in this section we provide both a) regional and b) subregional (Decomp domain) comparisons between the two baseline runs,
which have different hydrologic and water quality assumptions within the greater Everglades regional domain (e.g., P concentration in inflowing waters).
Basin-wide budgets
0.3 Mb, July 27, 2011 - ECB vs FWO: Water budgets for Water Conservation Areas receiving external inputs (ECB2_STAhistTSer, FWO2_STA10ugL runs).
0.3 Mb, July 27, 2011 - ECB vs FWO: P budgets for external flows to Water Conservation Areas receiving external inputs (ECB2_STAhistTSer, FWO2_STA10ugL runs).
Regional Performance Indicators (only provided for baseline run comparisons)
FYI, for the end-of-season TP concentrations in surface water: Dry season end is April, Wet season end is September; Example-Dry-Year is 1989, Example-Wet-Year is 1994, Example-Average-Year is 1978.
![]() 0.4 Mb, July 27, 2011 - ECB vs FWO: Summary table (area of marsh) of the hydro-ecological (primarily water quality) differences between the two baseline simulations (ECB2_STAhistTSer, FWO2_STA10ugL runs).
0.4 Mb, July 27, 2011 - ECB vs FWO: Summary table (area of marsh) of the hydro-ecological (primarily water quality) differences between the two baseline simulations (ECB2_STAhistTSer, FWO2_STA10ugL runs).
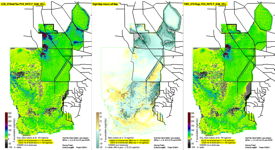 15.1 Mb, July 27, 2011 - ECB vs FWO: Maps of the hydro-ecological (primarily water quality) differences between the two baseline simulations (ECB2_STAhistTSer, FWO2_STA10ugL runs).
Regional Supplementary outputs (only provided for baseline run comparisons)
Additional ELM output variables are provided here, so that users may better understand/interpret some of the above Performance Indicator graphics. Included are difference-maps for a) P concentration in soil porewater, b) velocity (magnitude only) of surface water flows, c) surface water depth (POS mean, and seasonal snapshots), and d) chloride (Cl) concentration in surface water (conservative tracer of flows). POS = Period-Of-Simulation.
FYI, for the end-of-season surface water depths: Dry season end is April, Wet season end is September; Example-Dry-Year is 1989, Example-Wet-Year is 1994, Example-Average-Year is 1978.
17.3 Mb, July 27, 2011 - ECB vs FWO: Maps of additional, supplemental, hydro-ecological differences between the two baseline simulations (ECB2_STAhistTSer, FWO2_STA10ugL runs).
Sub-regional, Decomp-domain Performance Indicators
FYI, for the end-of-season TP concentrations in surface water: Dry season end is April, Wet season end is September; Example-Dry-Year is 1989, Example-Wet-Year is 1994, Example-Average-Year is 1978.
![]() 0.4 Mb, July 27, 2011 - ECB vs FWO: Summary table (area of marsh) of the hydro-ecological (primarily water quality) differences between the two baseline simulations (ECB2_STAhistTSer, FWO2_STA10ugL runs).
0.4 Mb, July 27, 2011 - ECB vs FWO: Summary table (area of marsh) of the hydro-ecological (primarily water quality) differences between the two baseline simulations (ECB2_STAhistTSer, FWO2_STA10ugL runs).
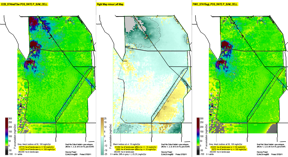 11.6 Mb, July 27, 2011 - ECB vs FWO: Maps of the hydro-ecological (primarily water quality) differences between the two baseline simulations (ECB2_STAhistTSer, FWO2_STA10ugL runs).
For evaluations of Decomp Project Alternatives, all Performance Indicator comparisions are made within the Decomp-domain (i.e., not Regional), making relative comparisons to the Future WithOut Project (FWO) Base.
In addition to the formal Performance Indicator metrics, we provide Supplementary Output metrics within the Decomp-domain. These are additional ELM output variables, provided so that users may better understand/interpret some of the above Performance Indicator graphics.
Included are difference-maps for
Summary of Performance Indicator Results for the Bases and all Alternatives - as new Alternatives become available, results will be added.
![]() 3.3 Mb, Jan 6, 2012 - ECB, FWO, ALTA, ALTB, ALTG, ALTC, ALTE, ALTF, ALTH: Summary graphic (area of marsh within the Decomp-domain) of the hydro-ecological (primarily water quality)
Performance Indicator differences between FWO and ECB, and between each ALT simulation relative to the FWO base.
(FYI, for the end-of-season TP concentrations in surface water: Dry season end is April, Wet season end is September; Example-Dry-Year is 1989, Example-Wet-Year is 1994, Example-Average-Year is 1978.)
3.3 Mb, Jan 6, 2012 - ECB, FWO, ALTA, ALTB, ALTG, ALTC, ALTE, ALTF, ALTH: Summary graphic (area of marsh within the Decomp-domain) of the hydro-ecological (primarily water quality)
Performance Indicator differences between FWO and ECB, and between each ALT simulation relative to the FWO base.
(FYI, for the end-of-season TP concentrations in surface water: Dry season end is April, Wet season end is September; Example-Dry-Year is 1989, Example-Wet-Year is 1994, Example-Average-Year is 1978.)
0.7 Mb xls file, Jan 6, 2012 - Excel (.xls) file containing the data table and graphics for above pdf file.
Alternative A
Performance Indicator Maps
11.4 Mb, Jul 27, 2011 - ALTA vs FWO: Maps of the hydro-ecological (primarily water quality) differences between the two simulations.
Supplementary Output Maps
13.8 Mb, Aug 9, 2011 - ALTA vs FWO: Maps of supplementary output.
Alternative B
Performance Indicator Maps
11.1 Mb, Jul 27, 2011 - ALTB vs FWO: Maps of the hydro-ecological (primarily water quality) differences between the two simulations.
Supplementary Output Maps
13.6 Mb, Aug 9, 2011 - ALTB vs FWO: Maps of supplementary output.
Alternative G
Performance Indicator Maps
11.1 Mb, Jul 27, 2011 - ALTG vs FWO: Maps of the hydro-ecological (primarily water quality) differences between the two simulations.
Supplementary Output Maps
13.5 Mb, Aug 9, 2011 - ALTG vs FWO: Maps of supplementary output.
Alternative C
Performance Indicator Maps
11.4 Mb, Aug 9, 2011 - ALTC vs FWO: Maps of the hydro-ecological (primarily water quality) differences between the two simulations.
Supplementary Output Maps
13.8 Mb, Aug 9, 2011 - ALTC vs FWO: Maps of supplementary output.
Alternative E
Performance Indicator Maps
11.4 Mb, Aug 9, 2011 - ALTE vs FWO: Maps of the hydro-ecological (primarily water quality) differences between the two simulations.
Supplementary Output Maps
13.8 Mb, Aug 9, 2011 - ALTE vs FWO: Maps of supplementary output.
Alternative F
Performance Indicator Maps
11.1 Mb, Aug 9, 2011 - ALTF vs FWO: Maps of the hydro-ecological (primarily water quality) differences between the two simulations.
Supplementary Output Maps
13.6 Mb, Aug 9, 2011 - ALTF vs FWO: Maps of supplementary output.
Alternative H
Performance Indicator Maps
11.2 Mb, Jan 6, 2012 - ALTH vs FWO: Maps of the hydro-ecological (primarily water quality) differences between the two simulations.
Supplementary Output Maps
13.7 Mb, Jan 6, 2012 - ALTH vs FWO: Maps of supplementary output.
 EcoLandMod Projects