![]() Background |
Models |
Projects |
Publications |
People |
News
Background |
Models |
Projects |
Publications |
People |
News
![]() Background |
Models |
Projects |
Publications |
People |
News
Background |
Models |
Projects |
Publications |
People |
News
Scope of Projects
Everglades regional: Sulfer & MeHg
Everglades subregional: WCA2A Wading Bird Suitability
Florida Coastal Everglades LTER
Everglades regional: SERES project
Spain Segura Basin: Ecological Economics
Everglades regional: CERP ASR
Everglades regional: CERP Decomp
Everglades WCA-1: unique restoration
Louisiana Davis Pond: restoration prototype
Everglades regional: cal/val (ELM v. 2.8)
Everglades regional: cal/val (ELM v. 2.5)
The target audience for this page is the inter-agency team evaluating the CERP Aquifer Storage and Recovery (ASR) Project.
In support of this project,
we developed a new ELM (v2.8.6) module to simulate sulfate fate and transport within the greater Everglades region. Given the
application objectives, the new sulfate module simply employs a "first-order" settling rate approach to aggregate the multiple
ecological processes involved with in-marsh sulfate losses from the surface water column.
The U.S. Army Corps of Engineers is funding this ELM development and application project.
This page provides the ASR Project team with results of their requests to provide ELM simulation results under the different Baseline and Alternative planning scenarios.
The Model Documentation report on the ELM v2.8.6 historical hindcasting (calibration) performance assessment for the new sulfate module
(including data, code, and model performance assessment) is found in the Publications link.
Note: That Model Documentation Report is separate from the documentation of the ELM applications that supported analysis of ASR alternatives, which is the topic of this web page.
After acceptable calibration/validation model performance assessments, the regional 500 m grid resolution ELM
application was used to evaluate a suite of future scenarios of sulfate loading into the Everglades.
As described below, different ASR scenarios route ASR-derived sulfate through Lake Okeechobee, then into the Everglades Stormwater Treatment Areas (STAs) and the greater Everglades (domain of ELM).
The
Lake Okeechobee Environment Model, a new Simple Model of STAs (SMSTA), and other quantitative tools (see below) were used to establish boundary-condition
sulfate loads to the Everglades, with the ELM simulating the downstream landscape patterns of sulfate
availability over decadal time scales in the greater Everglades.
The results of this Everglades sulfate modeling effort will be utilized by U.S. Geological Survey mercury methylation experts
(Drs. William Orem and David Krabbenhoft) to quantify potential (sulfate-influenced)
mercury methylation patterns in the Everglades under the ASR future scenarios - for use in CERP team evaluation of this aspect of the ASR project.
This section links to documentation of model assumptions, inputs, and outputs for the 2050B2 and CERP0 ELM simulation runs for the ASR Project.
 Final summary report of the evaluations of ASR project Alternatives (4.4 Mb)
Timeline of updates to this page.
Page Contents - Links to Major headings
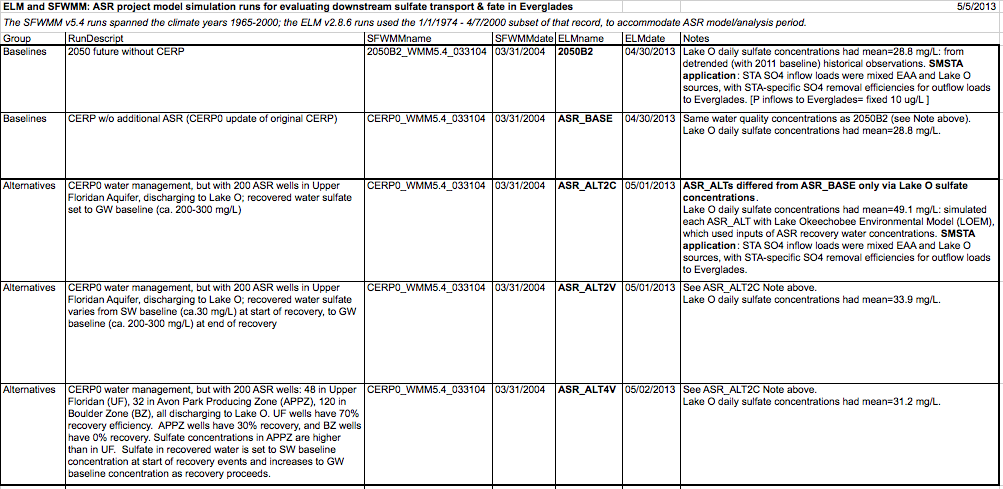
37 Kb - Summary table of input data for simulations.
1.4 Mb - Input map data that are common to all ASR project simulations.
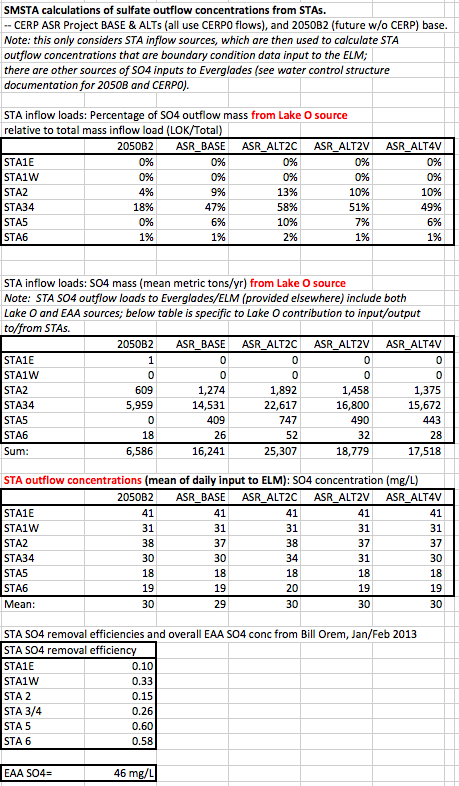
Simple Model of STAs (SMSTA), for estimating Stormwater Treatment Area (STA) sulfate outflow concentrations (input to the ELM/Everglades)
41 Kb, March 21, 2013 Brief documentation of SMSTA methods and assumptions.
ELM water management infrastructure data
Note: For detailed hydrologic assumptions used by the SFWMM (whose managed water control structure flows drive these ELM simulations),
please see the relevant documentation for the application of the SFWMM.
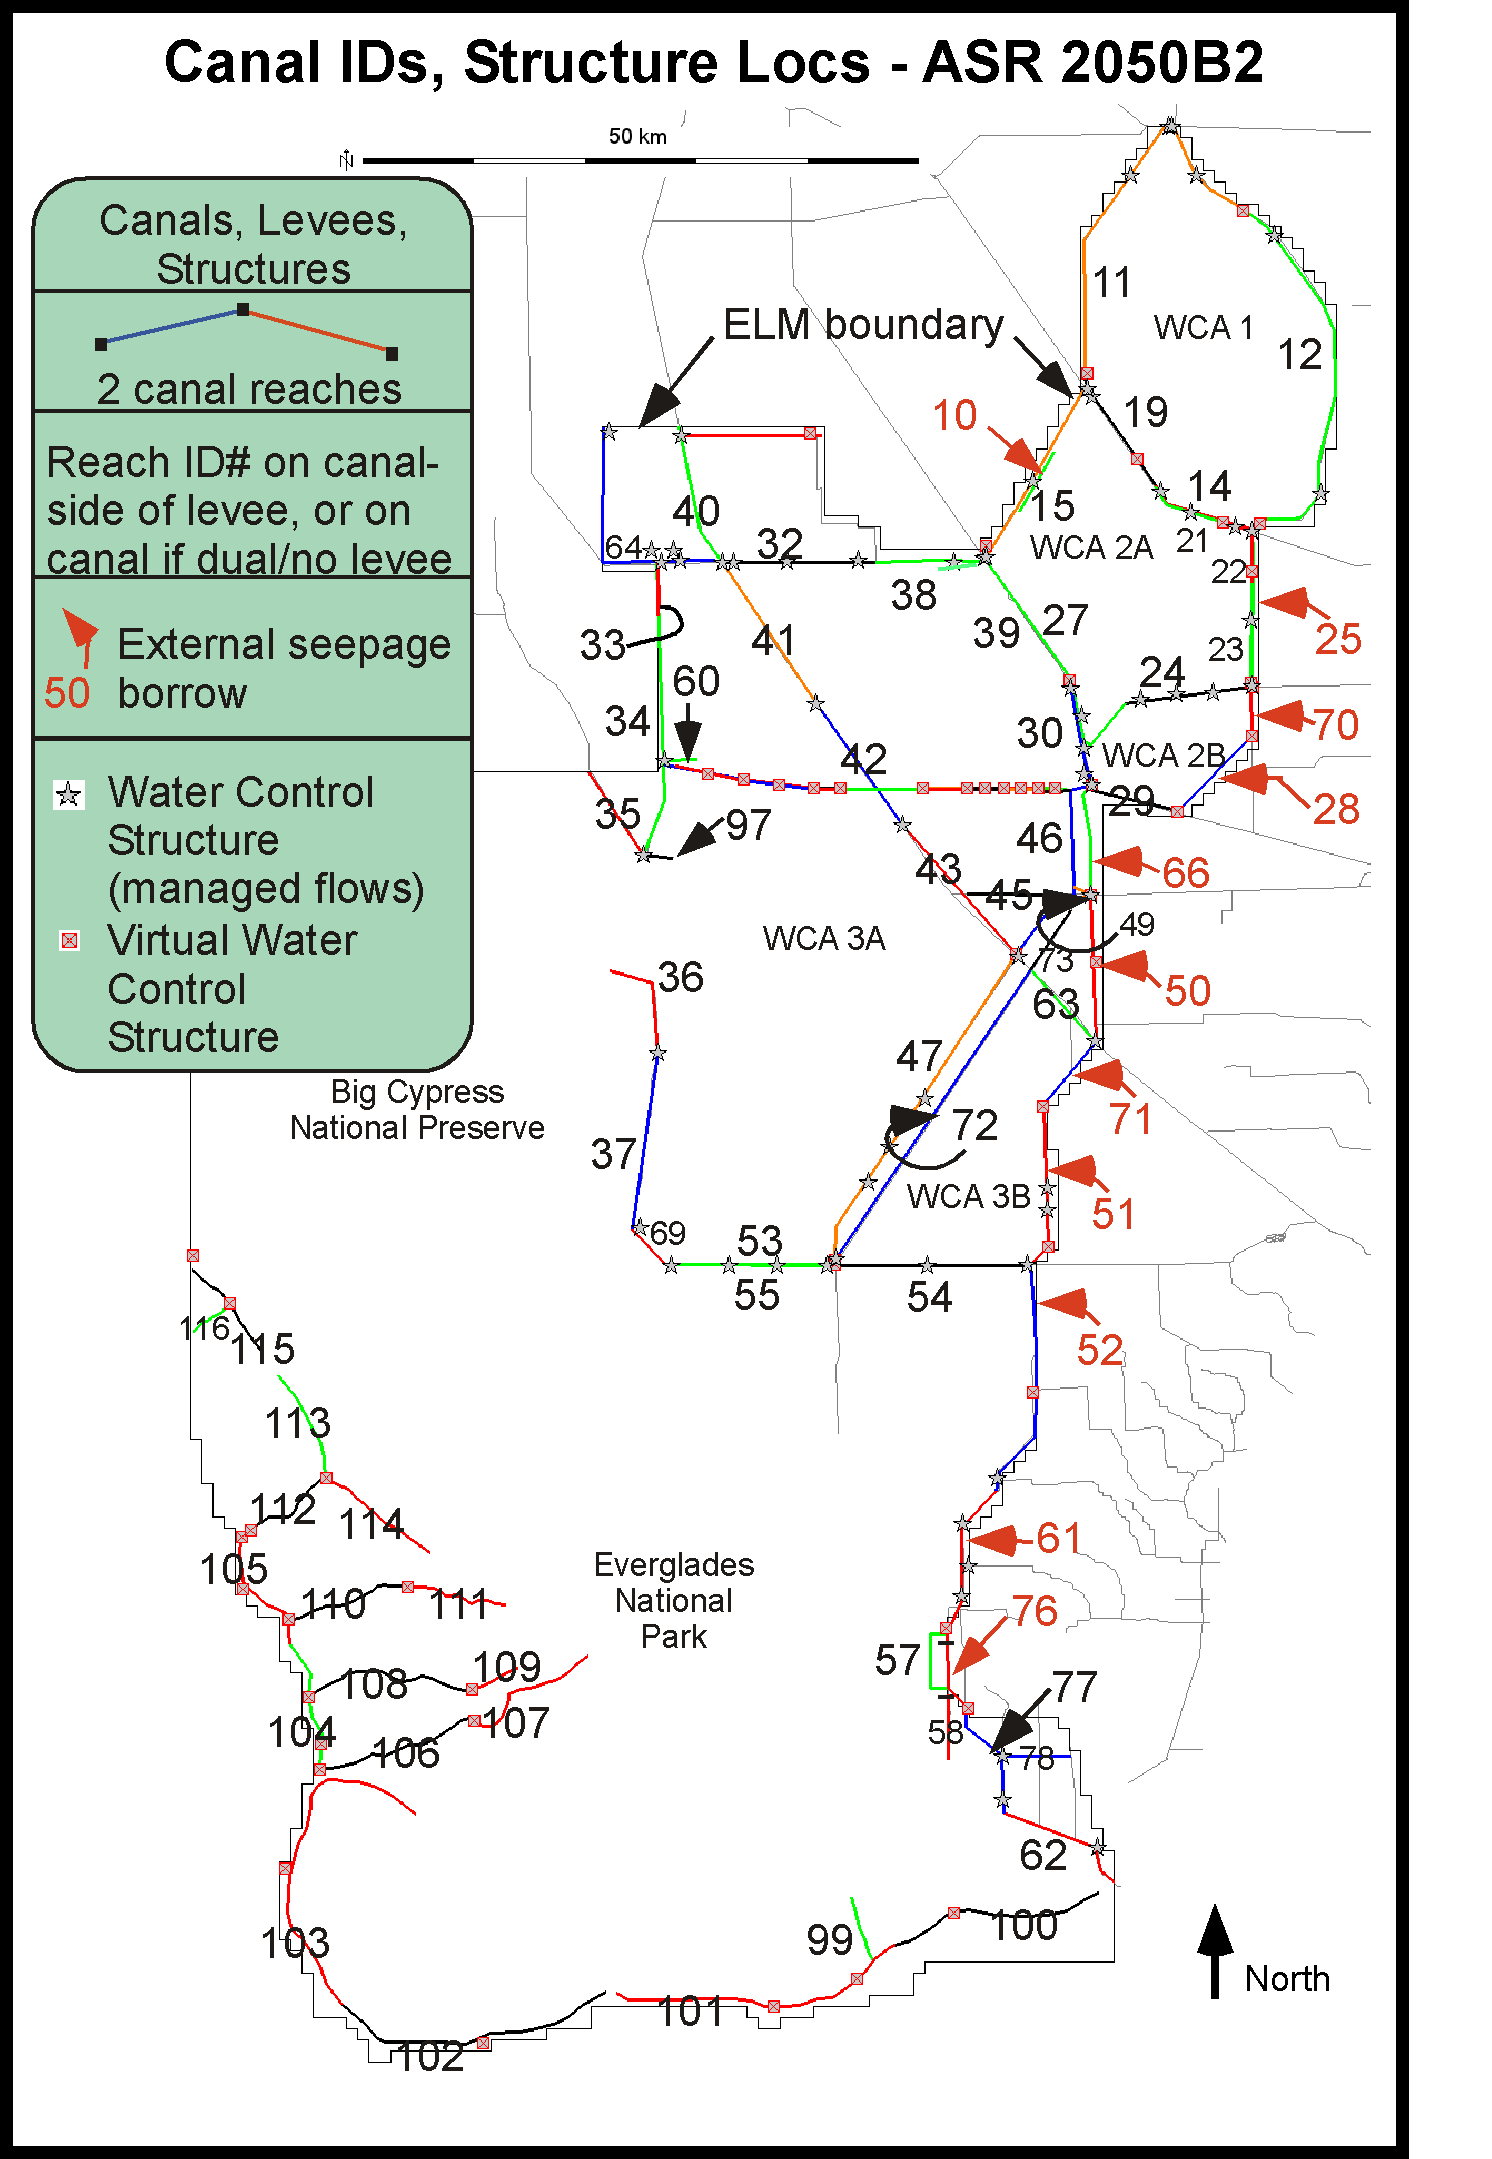
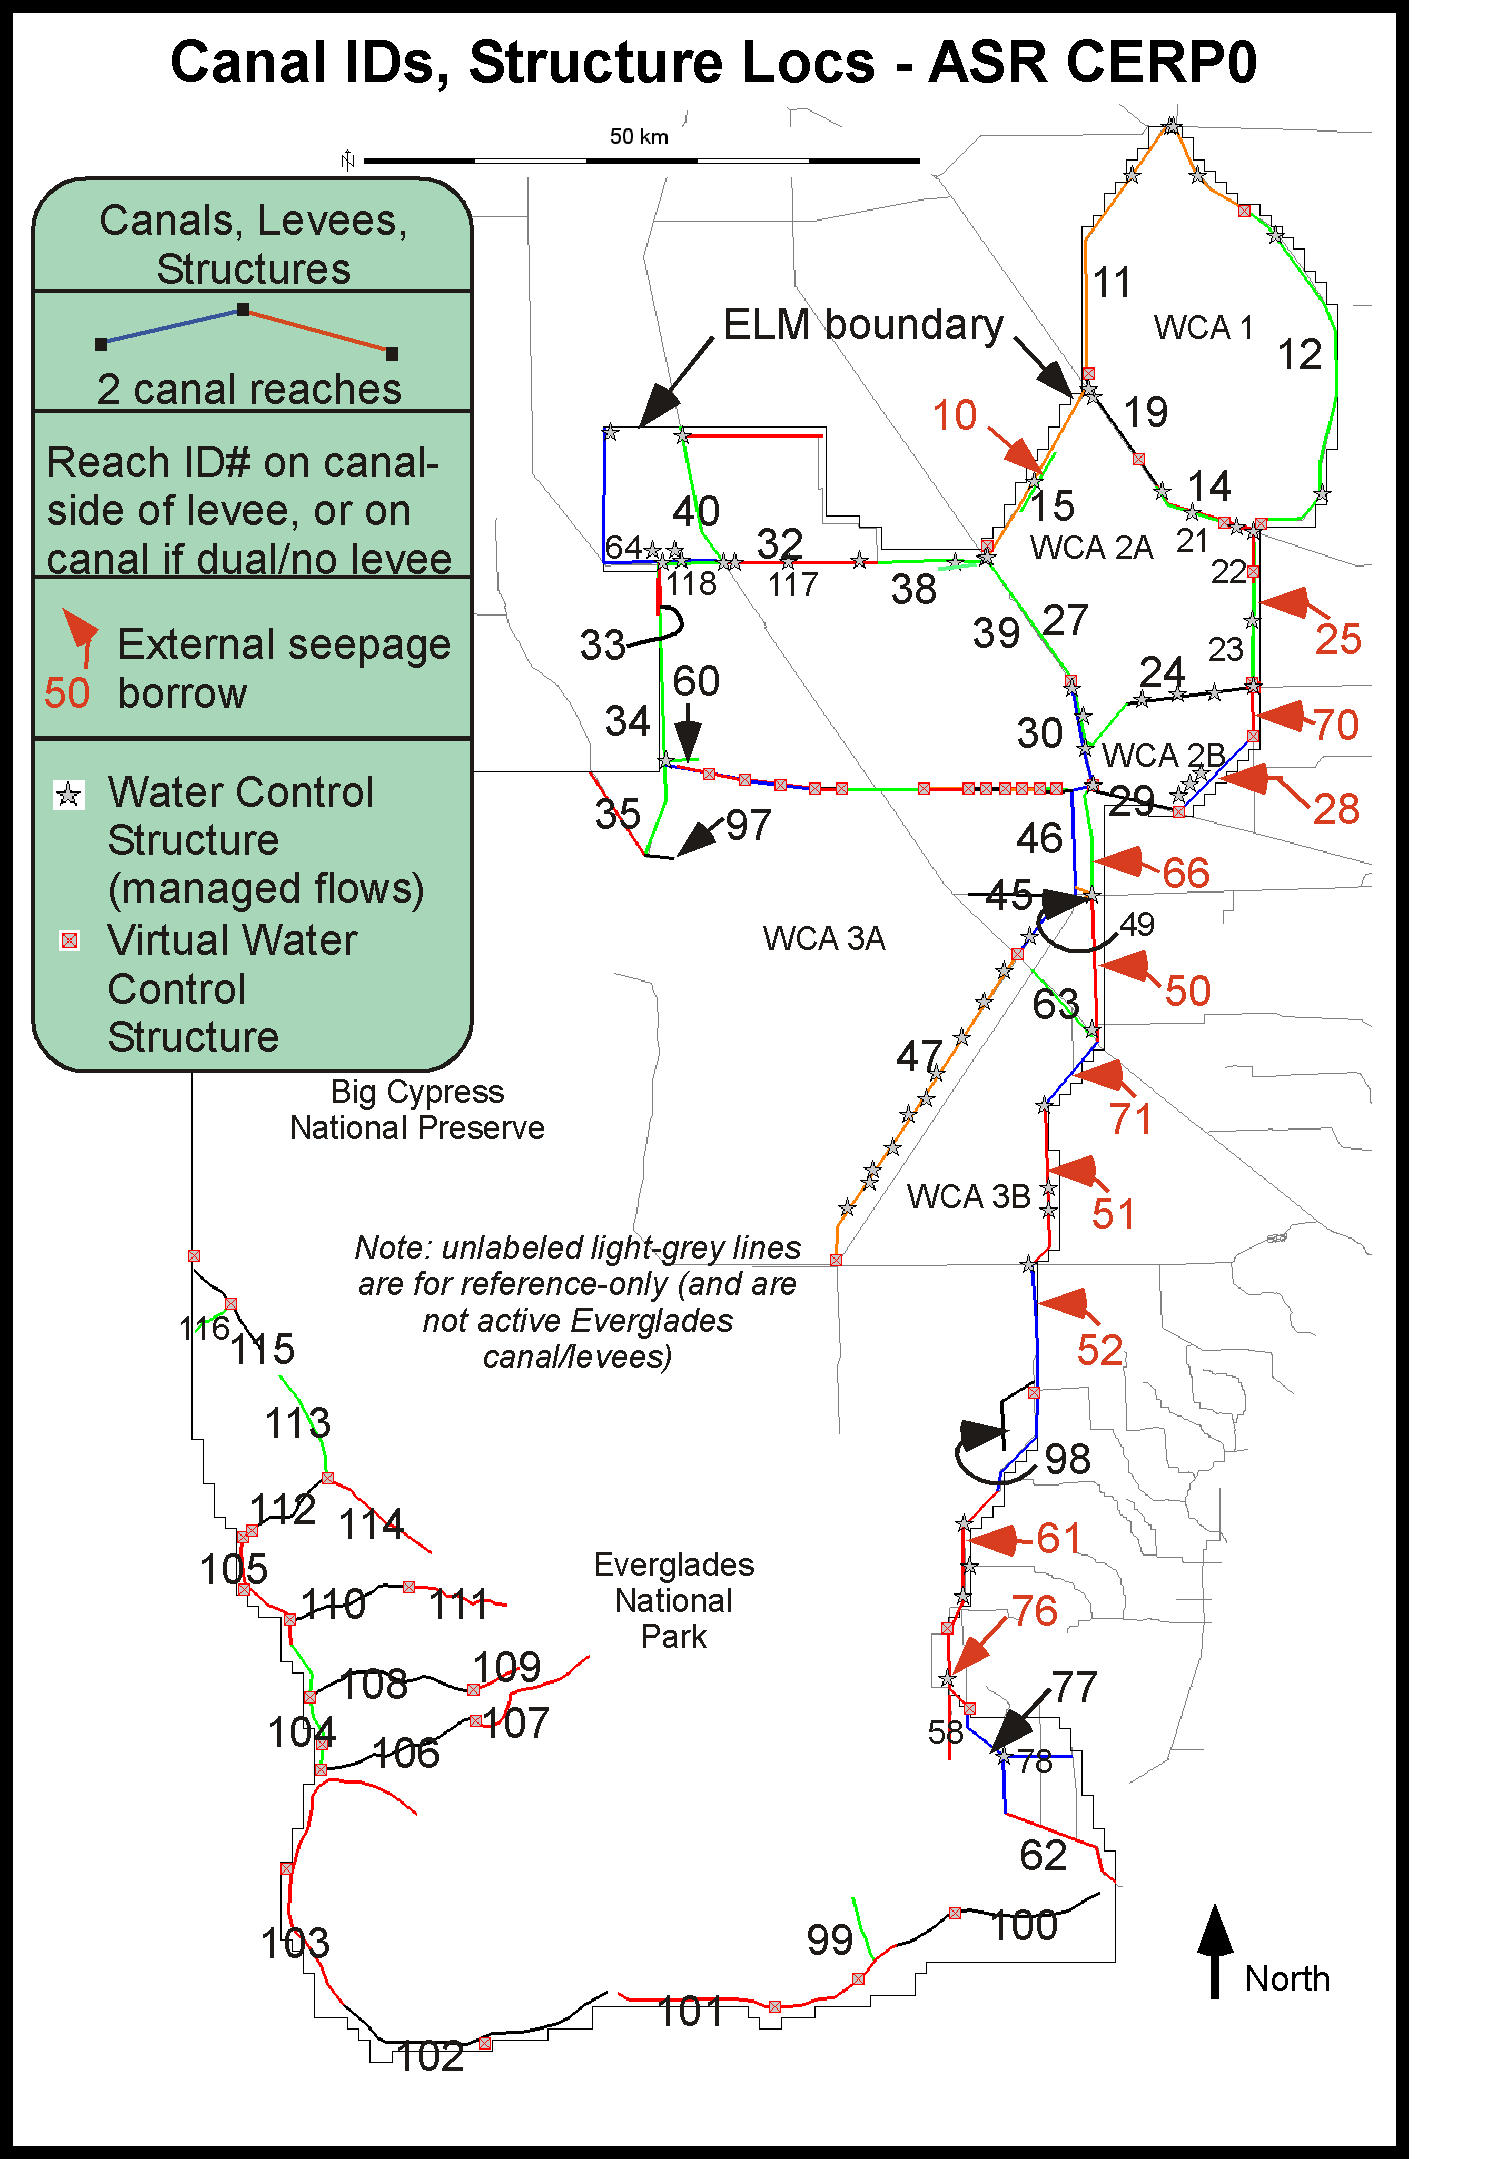
ELM canal/levee and water control structure maps, 2050B2 and CERP0.
ELM water control structures: database export graphics, 2050B2 and CERP0.
8.4 Mb, March 21, 2013 - 2050B2:
Water control structure attributes, including into-domain constituent (P, SO4, Cl) inflow concentrations.
8 Mb, March 21, 2013 - CERP0:
Water control structure attributes, including into-domain constituent (P, SO4, Cl) inflow concentrations.
0.1 Mb, May 5, 2013 -
Summary table of the Performance Measures/Indicators that are used to make relative comparisons among ELM-simulated baselines and alternatives.
Includes brief description of the Performance Measure or Indicator, and guidance on their use and interpretation.
For highly dynamic surface water quality variables (e.g., SO4 concentrations), Performance Measures/Indicators (see above Descriptions) include:
a) two Performance Measures of landscape Period of Simulation mean ("MeanPOS" in variable's name) sulfate concentration and sulfate reduction (loss), and
b) multiple Performance Indicators of seasonal "snapshots" which are end-of-season 30d averages ("MeanRAW" in variable's name) for "ASR stress periods". These stress periods
are defined in this document, with associated model outputs
to be used as Performance Indicators to estimate sulfate loads during the highest ASR-outputs (i.e., to be conservative, seeking the "worst
case" periods of potentially high sulfate loads to the Everglades). Those "snapshots" are for:
end of a dry season, above average Lake (and ASR) discharges (May 1974)
end of a wet season, above average Lake (and ASR) discharges (Oct 1974)
end of a wet season, below average Lake (and ASR) discharges (Oct 1981)
end of a dry season, below average Lake (and ASR) discharges (May 1982)
end of a wet season, average Lake (and ASR) discharges (Oct 1989)
end of a dry season, average Lake (and ASR) discharges (May 1990)
c) for Performance Indicators that are only available to compare the two Bases (2050B2 and ASR_BASE), we used our past standards for snapshots associated with hydrologic variation: those (Bases only) seasonal "snapshots" are end-of-season 30d averages ("MeanRAW" in variable's name) for three example years:
Dry season end is April,
Wet season end is September
Example-Dry-Year is 1989,
Example-Wet-Year is 1994,
Example-Average-Year is 1978.
Summary of Sulfate Performance Measure/Indicator Results (all Bases and Alts).
![]() 1.6 Mb, May 5, 2013 - 2050B2, ASR_BASE, ASR_ALT2C, ASR_ALT2V, ASR_ALT4V: Summary graphic (area of marsh within the model-domain) of the sulfate
Performance Measure/Indicator differences between 2050B2 and ASR_BASE, and between each ALT simulation relative to the ASR_BASE base.
1.6 Mb, May 5, 2013 - 2050B2, ASR_BASE, ASR_ALT2C, ASR_ALT2V, ASR_ALT4V: Summary graphic (area of marsh within the model-domain) of the sulfate
Performance Measure/Indicator differences between 2050B2 and ASR_BASE, and between each ALT simulation relative to the ASR_BASE base.
0.1 Mb xls file, May 5, 2013 - Excel (.xlsx) file containing the data table and graphics that generated the above pdf graphic.
Time Series of Sulfate Concentrations within Basin/Indicator-Regions (all Bases and Alts).
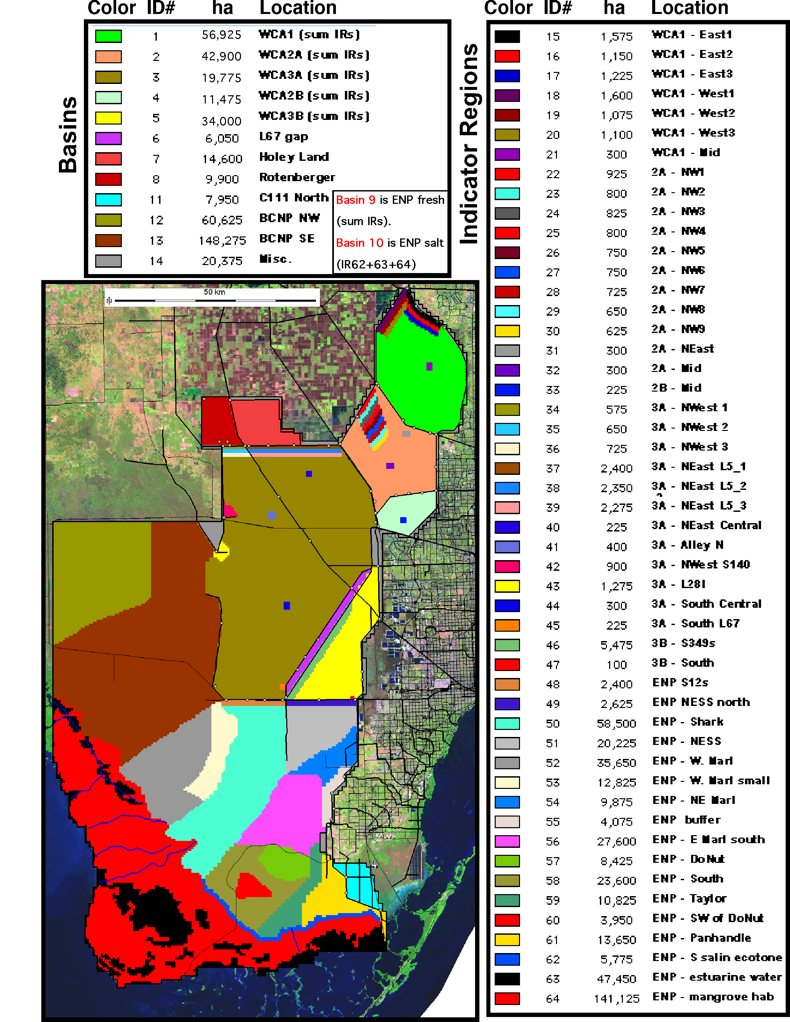
98.1 Mb, May 5, 2013 - Excel (.xlsx) file containing raw output data for 2050B2, ASR_BASE, ASR_ALT2C, ASR_ALT2V, ASR_ALT4V: Daily time series of sulfate
concentrations (and several other metrics) within each Basin/Indicator-Region.
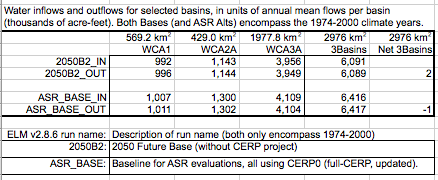
Bases Results: 2050B2 vs CERP0 (ASR_BASE)
As indicated above in the SFWMM and ELM simulation run descriptions, we considered two future-baseline runs: a) the 2050 future without CERP is the 2050B2 baseline, and b) the ASR_BASE is the formal baseline for evaluating ASR Project Alternatives - the ASR_BASE is the future with CERP (updated to CERP0), but without the additional ASR Alternatives that are being evaluated for this ASR Project.Budget results: Water inflow/outflow budget summary - 2050B2 vs CERP0 (ASR_BASE)
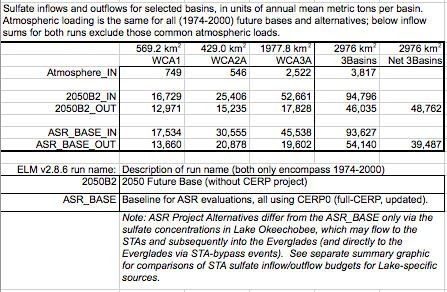
Budget results: Sulfate inflow/outflow budget summary - 2050B2 vs CERP0 (ASR_BASE)
Performance Measures & Indicators Maps
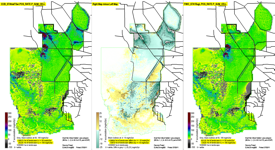 40 Mb, May 5, 2013 - ASR_BASE vs 2050B2: Maps of the SO4 and other hydro-ecological Performance Measure/Indicator differences between the two simulations. The comparison of these two baseline
runs is not part of the evaluation of the ASR Alternatives relative to the ASR_BASE (see below).
40 Mb, May 5, 2013 - ASR_BASE vs 2050B2: Maps of the SO4 and other hydro-ecological Performance Measure/Indicator differences between the two simulations. The comparison of these two baseline
runs is not part of the evaluation of the ASR Alternatives relative to the ASR_BASE (see below).
Raw output file(s)
 To-be-posted - 2050B2: "Raw" sulfate concentration model output, in NetCDF format; this is a map-time-series of 30-day mean map values of surface water sulfate concentrations during the Period of Simulation.
(This self-documented netCDF file adheres to the CERP NetCDF standard). [See multiple options for OpenSource software
to view and analyze these data; be sure to check out "EverView" - very user-friendly visualization software!]
To-be-posted - 2050B2: "Raw" sulfate concentration model output, in NetCDF format; this is a map-time-series of 30-day mean map values of surface water sulfate concentrations during the Period of Simulation.
(This self-documented netCDF file adheres to the CERP NetCDF standard). [See multiple options for OpenSource software
to view and analyze these data; be sure to check out "EverView" - very user-friendly visualization software!]
To-be-posted - ASR_BASE: "Raw" sulfate concentration model output, in NetCDF format; this is a map-time-series of 30-day mean map values of surface water sulfate concentrations during the Period of Simulation.
(This self-documented netCDF file adheres to the CERP NetCDF standard). [See multiple options for OpenSource software
to view and analyze these data; be sure to check out "EverView" - very user-friendly visualization software!]
ASR_ALT2C Results
Performance Measures & Indicators Maps
9 Mb, May 5, 2013 - ASR_ALT2C vs ASR_BASE: Maps of the SO4 Performance Measure/Indicator differences between the two simulations.
Raw output file
To-be-posted - ASR_ALT2C: "Raw" sulfate concentration model output, in NetCDF format; this is a map-time-series of 30-day mean map values of surface water sulfate concentrations during the Period of Simulation.
(This self-documented netCDF file adheres to the CERP NetCDF standard). [See multiple options for OpenSource software
to view and analyze these data; be sure to check out "EverView" - very user-friendly visualization software!]
ASR_ALT2V Results
Performance Measures & Indicators Maps
9 Mb, May 5, 2013 - ASR_ALT2V vs ASR_BASE: Maps of the SO4 Performance Measure/Indicator differences between the two simulations.
ASR_ALT4V Results
Performance Measures & Indicators Maps
9 Mb, May 5, 2013 - ASR_ALT4V vs ASR_BASE: Maps of the SO4 Performance Measure/Indicator differences between the two simulations.
 EcoLandMod Projects